Blog

Combien de pages du Web existe t-il dans les index Google?

Dans un nouveau communiqué, Google a indiqué qu’ils explorent à travers leur robots environ 130 trillion de pages. Selon les estimations faites par certains experts, Google aurait augmenté de 100 trillions de pages en 4 ans. Ceci n’est pas très surprenant dans la mesure où Google avait complètement revue son infrastructure d’exploration du web (Hummingbird) d’une part. D’autres part on peut imaginer que l’enrichissement sémantique des pages proposés suite à l’avènement du knowledge graph de Google permet aux robots de mieux comprendre le contexte et la signification des éléments ce qui pourrait faciliter leur exploration et les choix faits pour passer d’une page à une autre

Combien de pages google a dans son index

Rappelons que le crawl et l’indexation d’une page constitue la première étape du référencement naturel. Si Google n’explore pas le contenu de votre page, elle ne peut apparaitre dans les résultats de recherche et les internautes ne pourront pas y accéder par Google.

Le document rappelle l’importance des liens internes et de leur syntaxe pour la découverte de l’ensemble du contenu du site.


Amazon Prime ou le succès de la fidélisation en Marketing

Connaissez vous le programme Amazon prime? 

En février 2005, Amazon lançait le programme PRIME en misant sur la livraison rapide de millions d’articles. Le pari de la compagnie à l’époque était clairement de faciliter l’expérience d’achat en ligne. En effet les magasins physiques avaient pour avantage de proposer un modèle sans livraison. Tu vas en magasin, tu achètes une robe ou un jeans, tu rentres avec le produit chez toi, pas besoin d’attendre la livraison. Ce programme apportait donc un bénéfice direct à la vente en ligne en réduisant au maximum les freins à l’achat. Si le produit n’est pas très onéreux et si la livraison est rapide, le consommateur est heureux. C’était le pari et 11 ans plus tard les chiffres donnent raison à AMAZON.

Amazon prime

Nombre de membres Amazon Prime

La progression folle des marchands du programme PRIME est une leçon pour toutes les marques qui se lancent dans la fidélisation. En effet au 3e trimestre 2016, le programme PRIME avait 49.5 millions de membres aux USA selon la firme Cowen & Co soit 23% de plus qu’au troisième trimestre 2015.

Amazon prime - évolution des membres et abonnés

Les membres Prime font plus de commandes sur AMAZON que les non-membres. En octobre 2016, 57% des commandes passées sur AMAZON étaient le fait des membres “Prime”. Ils étaient seulement 49% en 2015. Etatnt donné que 50% des produits vendus sur AMAZON proviennent des autres marchands, petits entrepreneurs Amazon a étendu son programme FBA à ces denriers afin de faciliter la vente et la livraison de produits pendant la périodes du black friday et Cyber monday

Que peuvent faire les marques?

Il faut noter que de nombreuses marques sont vendues et seront toujours vendus sur AMAZON. De nombreux avantages existent en effet pour les marques qui souhaitent pénétrer le marché américain sans y ouvrir de magasins physiques. Il y’a un temps où les marques considéraient AMAZON comme un concurrent, la réalité est que AMAZON est désormais un partenaire, un peu comme Facebook Ads ou Google Adwords. Ces sites ne sont pas des concurrents mais des plateformes permettant de rejoindre un nombre très important de prospects et clients. Ainsi grâce à leur réputation qui ne cesse de croître et la confiance que les clients leur accordent, une logistique et des process de facturation et de livraison de qualité, les équipes Amazon disposent de tous les atouts pour développer le potentiel des petits marchands.

Read More : https://www.washingtonpost.com/news/the-switch/wp/2015/02/03/what-amazons-learned-from-a-decade-of-prime/?utm_term=.e53817b7ae94

Comment collaborer avec les influenceurs

Les influenceurs se sont toutes les personnes qui aggrègent autour de leur personnalité et de leur profil une audience. Il peut s’agir :

  • De journalistes
  • D’écrivains
  • De bloggeurs, bloggeuses, Instagrameurs
  • De you Tubers
  • De conseillers politiques
  • Consultants de renom
  • Etc

En réalité chaque niche ou segment de marché a ses propres règles et j’ai souvent coutume de dire qu’il faut faire une analyse de la niche afin d’identifier les influenceurs.

Les influenceurs un poste de dépenses parmis tant d’autres

Au fil des années, on a vu les budgets d’acquisition changé. Par le passé il était assez simple pour les responsables marketing d’organiser leur budget autour des médias traditionnels

  • TV
  • Radio
  • Affichage
  • Presse écrite
  • etc

A cette époque (où le numérique n’était pas aussi prépondérent) les plans médias s’articulaient autour des éléments ci-dessus mentionnés. Grâce ou à cause d’internet, l’équation est devenu encore plus complexe. L’arrivée des régies en ligne et notamment les plus puissantes d’entre-elles Google Adwords ou Facebook ont éduqué pendant ces dernières années les marketers. On est donc passé d’une répartition du budget entre les médias traditionnels à avoir en plus à gérer

  • Les liens sponsorisés
  • Le retargeting
  • Google Adsense
  • Double click
  • Facebook Ads
  • etc

Mais ce n’est pas tout car à côté des plateformes d’Emailing, les plateformes d’affiliation, les comprateurs de prix, les places de marché comme Amazon le marketing d’influences continuent de poser de sérieuses difficultés aux marketers qui cherchent à maximiser leurs investissements. Il n’est donc plus surprenant de lire des études sur un changement de culture. Les responsables marketing souhaitent désormais se concentrer sur les résultats de tests pour se faire leur propre opinion.

Comment identifier les influenceurs aujourd’hui

1- Utilisez Twitter

L’outil followerwonk de Moz est celui que je privilégie pour cette recherche d’influenceurs. En effet cet outil foncitonne comme un moteur de recherche vous permettant d’identifier les internautes de la communautés Twitter qui sont des journalistes, écrivains, etc. L’outil propose différents indicateurs de mesure de l’influence des abonnés Twitter permettant ainsi de les classer selon leur capacité à propager votre message par exemple ou leur nombre d’abonnés.

2- Utilisez Linkedin

Linkedin est très souvent négligé et pourtant peu de bloggeurs, journalistes et influenceurs se font approcher par ce canal. Grâce à un compte Premium vous avez différentes options de filtres pour affiner votre recherche.

3- Utilisez Google

Gratuit et simple. Allez sur google et recherchez des articles qui couvrent ou qui rassemblent les récents classements d’influenceurs est une très bonne astuce. Par exemple :

  • Classement des blogs français
  • Meilleurs blogs de mode homme ou femme
  • Tops blogs en France
  • etc

4- Utilisez Instagram ou Pinterest

Si vous travaillez dans la mode, la bijouterie, le luxe ou encore la décoration il y’a de fortes chance que votre audience soit sur ces deux plateformes. Par conséquent, il faut y passer du temps afin d’identifier les comptes qui rassemblent le plus d’abonnés

Comment collaborer avec les bloggeurs et autres influenceurs

L’approche traditionnelle

Une fois que vous avez les coordonnés de l’influenceur en question, un simple Email suffit pour prendre contact. Parfois il peut être utile de contacter poliment la personne sur Twitter ou Linkedin avant un email ou un appel. Notez qu’il s’agit ici de contruire des relations sur le long terme. Les bloggeurs et influenceurs sont des professionnels aue vous pourrez solliciter plusieurs fois tout au long de votre carrière, il faut donc collaborer et viser l’établissement de relations durables et pas l’inverse.

Passer par une régie

Certaines régies aggrègent des communautés de bloggeurs, journalistes et contributeurs. Une façon rapide de lancer votre campagne peut simplement être de passer par une régie.

Franck NLEMBA

Consultant commerce electronique


L’évolution des pages de résultats Google et les nouveaux défis des webmasters

Cet article vous présente le contexte du web et la difficulté pour les marketeurs de rencontrer leurs cibles au bon moment. A la fin de cet article je vais évoquer les solutions possibles pour rencontrer la demande de manière efficace et construire un avantage concurentiel sur la durée.

Facebook domine l’engagement mais faut pas ignorer Google

Toutes les statistiques aux USA et dans le monde nous montre que nous sommes bien entrés dans l’ère des réseaux sociaux.

statistiques des sessions facebook vs Google

L’intelligence artificielle pour battre Facebook et gagner plus de revenus publicitaires

Dans un article paru dans Forbes, on estime que le marché de la publicité en ligne aux USA est en forte croissance. Le problème c’est que cette croissance va vers Facebook et Google. Les deux géants du web comptaient en 2016 pour plus de 65% des dépenses publicitaires aux USA.

Une récente étude faite sur $2.9 milliards de dépenses publicitaires a révélé que c’est presque impossible pour les marketeurs aujourd’hui d’investir sur une autre plateforme que Google ou encore Facebook.

La réalité est que ces deux leaders ont une telle avance en tout point de vue sur la compétition qu’il serait très difficile aujourd’hui pour une autre plateforme d’espérer les battre sur la durée.

Si Google domine les investissements publicitaires en terme de part de marché rien ne dit que ceci va durer. En effet Facebook est aussi propriétaire de Instagram, Whatsapp notamment et la plateforme ne cesse d’évoluer pour convaincre les marques. Reppellons pour l’exercice les audiences respectives de ces celles-ci:

Facebook : +1 milliard de membres

Whatsapp : +1 milliard d’utilisateurs, read more

Instagram : +400M de membres actifs en 2015, Ressource

Facebook Messenger : +1 milliard de membres, Ressource

evolution de l'audience facebook messenger

Les plateformes sociales de Facebook sont là où les internautes passent le plus de temps aujourd’hui. Ce qui revient à dire que les marques ont peut être plus de chances de les rencontrer à différentes stades du tunnel d’achat.

Tout récemment, Facebook a fait une percée dans la mesure d’audience en lançant son outil d’analyse Facebook Analytics pour justement proposer une alternative à la domination de Google Analytics, lancée à l’époque pour prouver que les dépenses publicitaires en ligne sont plus efficaces que la TV ou tout autre canal car on peut mesurer ce qui se passe concrètement.

La question qui se pose est donc comment Google peut aussi devenir un site qui propose une forme d’engagement? Comment un moteur de recherche qui nous a habitué à répondre simplement à nos questions peut-il continuer à être pertinent lorsque nous n’avons plus de questions à poser car les réponses nous viennent directement de nos proches sur Facebook Messenger ou encore Whatsapp?

A l’évidence, seuls les employés de Google savent ce qui se passe. Mais au niveau Marketing faisons quelques observations:

1/ Google s’est réorganisé en interne pour intégrer plus d’intelligence artificielle et notamment les équipes deepmind, lire ici
2/ Le département BRAIN dirige tout actuellement chez Google
Google brain team
Les nombreuses publications de Google le prouvent (voir cette vidéo de Jeff Dean)

Google a publié plus de 90 rapports de recherche sur l’intelligence artificielle avec pour objectif de rendre les machines plus intelligente encore.


3/ Google s’est même lancé dans la course aux talents ici à Montréal

Ressource : https://www.wired.com/2016/11/google-opens-montreal-ai-lab-snag-scarce-global-talent/
4/ Google fait des tests pour rendre encore plus efficaces les publicités Adwords

L’essentiel des revenus de Google vient d’Adwords (leur régie publicitaire). Si il y’a donc un point critique sur lequel tester l’impact des l’AI ce serait de voir l’intégration de cette technologie au niveau de la division qui génère plus de 90% des profits. Google a donc introduit “smart bidding” pour pousser les publicités pertinentes mais aussi Google a lancé l’AI pour tester et mesurer l’impact positif de l’annonce en gros si l’annonce publicitaire a marché.


5/ Google Now ou encore le mobile sera l’assistant personnel des utilisateurs Google

L’arme absolue pour augmenter l’engagement est que vous soyez toujours connectés à Google à travers votre mobile qui va vous indiquer ce qui se passe au niveau de votre agenda, l’actualités des sujets qui vous intéressent, A quel moment allez au restaurant pour éviter l’affluence et les files, etc

La progression des résultats de recherche du type OK Google montre que les internautes utilisent de plus en plus la recherche vocale depuis leur mobile. Ce comportement est à associer au changement d’attitude du mobinaute qui “parle” à son téléphone, ce dernier est donc un assistant vocale.

OK google trends

Google Now c’est l’assistant tout court

OK google trends

Et Google ne s’arrête pas là. Aujourd’hui l’utilisation du Deep Learning dépasse le scope du Search. On le retrouve sur quasiment tous les produits:

  • Android
  • Apps
  • Gmail
  • Compréhension des images
  • Maps
  • etc

Comment les marketeurs peuvent s’adapter

i) Le contexte de la recherche de l’internaute est beaucoup plus important que les mots

50% des résultats ne sont pas cliquable à cause du knowledge graph. Les différentes analyses que nous avons faites révèlent que tous les types de sites sont impactés par des résultats de recherche sur lesquels Google donne directement la réponse.

Mais avant de parler de l’impact du knowledge graph il faut souligner que les changements de Google ne visent pas juste les marques et les enseignes, mais surtout à aider l’internaute. Par exemple quelle est la météo à Montréal?

Astuce : Tagger le contenu du site de manière à être listé dans le Google knowledge graph, 

Ressource : Demander à un développeur de travailler sur l’API 

ii) La recherche universelle est censés booster l’engagement

Coder votre texte afin qu’il génère plus d’engagement et d’actions. L’erreur que beaucoup de webmasters font c’est de considérer l’internaute comme un individu passif, qui doit juste consommer le contenu. En réalité le mobile permet à l’internaute d’être beaucoup plus actif qu’on le croit car il peut passer un appel en utilisant les fonctionnalités du téléphone, agrandir une image de produit, prendre une photo de lui même, rechercher la direction vers vos magasins, etc.

Par exemple pour prendre une photo sur son téléphone l’internaute doit activer sa caméra. En général cette action va entrainer de la part du Mobinaute l’autorisation d’accéder à sa gallérie. Il est par exemple difficile d’utiliser Instagram ou même Facebook sans autoriser l’accès à votre gallérie. Il est presque impossible d’utiliser les fonctionnalités vocales de Waze sans autoriser l’accès aux commandes vocales de son téléphones, etc

Ressource : Tagger votre contenu grâce à Facebook open graph, schema.org, etc. En savoir plus

iii) Distinguer les prospects des clients grâce à Facebook

Facebook est un outil très puissant lorsqu’il s’agit de toucher des internautes ou mobinautes qui répondent à des critères socio-démographies précis. Par exemple

  • Identifier sur Montréal tous les francophones qui aiment la mode et qui ont vécu à Paris?
  • Identifier les journalistes du NYTimes qui aime nintendo
  • etc

La technique que nous voyons le plus émergé comme le précise l’agence digitale Armstrong, serait d’utiliser Facebook pour l’acquisition de prospects. De cette façon on va utiliser les “custom audience” pour re-cibler dans une autre phase du tunnel d’achat les internautes qui ont déjà été en contact avec nous et qui ont ou pas visiter le site web. Une fois que l’internaute est déjà venu sur le site, il est plus facile de le cibler à nouveau par le search et pourquoi pas grâce à la personnalisation des résultats de recherche Google va commencer à suggérer votre site sur Google Now.

iv) Imiter Amazon : Soyez fou du consommateur

Très récemment AMAZON a annoncé des changements visant à pousser les marchands sur sa plateforme à respecter la nouvelle politique de retour de marchandises. Cette actualité peut sembler anodine mais elle en dit long sur une entreprise qui a construit son succès sur la satisfaction du consommateur.

Amazon est fou des consommateurs. Ils appliquent tout ce que les consommateurs veulent comme le montre cette étude sur les services les plus valorisées par les consommateurs américains. On peut voir que dans le top 3 se trouvent:

  • La livraison gratuite
  • La livraison le même jour
  • Le retour gratuit

Si vous avez ces trois réunis, l’acte d’achat devient assez facile à faire.

services e-commerce

Je suggère donc de mettre en place tous les mécanismes de traitement des besoins récurrents des consommateurs. Beaucoup d’entreprises ont déjà des mécanismes de collectes de feedback, que ce soit par les formulaires en place sur les sites E-commerce ou le chat. Mais comment traiter tout ce flow d’informations? Beaucoup n’y sont pas préparés. Un poste qui serait utile en marketing serait un Incident Manager en l’occurence.

L’achat d’un produit en ligne est stressant en plus on dépense et de plus on laisse son numéro de carte de paiement, etc. Le marketing doit tout faire pour RASSURER le consommateur. Rassurer le consommateur signifie lui garantir une sécurité “ressentie” et mettre le produit à sa disposition le plus tôt possible.

v) Utiliser les nouveaux outils statistiques pour mieux analyser les besoins des internautes.

Les consommateurs d’expriment sans cesse. Sur Quora, Goodreads, Amazon Reviews, Aufeminin.com, etc Mais comment tirer des insights de tout ce contenu?

Je suggère d’intégrer des analystes quantitatifs et qualitatifs dans les départements marketing. L’analyse de données est un vrai métier qui demande une réelle expertise. Un analyste pourra assez facilement extraire les informations les plus pertinentes de ce flux de commentaires et d’avis ou encore de construire des modèles d’analyses appropriés. Deux outils peuvent être utile ici:

https://monkeylearn.com/

A défaut vous pourrez aussi avoir recours à des analystes en ligne. De nombreuses communautés de statisticiens se créent et ce serait utile de recruter des experts depuis ces communautés. Quelques exemples existent notamment : https://www.experfy.com/

En conclusion, les responsables marketing pour survivre doivent à nouveau se réapproprier le consommateur et ne pas tout abandonner aux plateformes. Google et Facebook sont des carrefours d’audience mais grâce à la technologie ils sont capables d’en savoir plus sur le consommateur final que beaucoup de marques.

L’enjeu je dirais est donc de revoir les CRM et de traiter la data client avec obsession.


Amazon’s Full-Funnel Pivot: What the 2026 Upfront Means for Health and Nutrition Brands

Retail Media · Commerce Media · 2026 Outlook

At its 2026 Upfront, Amazon stopped acting like a retail media network and started acting like a TV network with a checkout button. Most health and nutrition brands haven’t restructured their playbooks. Here’s what that costs them.

By Franck N’Lemba · 12 min read

Let’s be honest. Most health and nutrition marketers I talk to still treat Amazon as a conversion line item. It sits in the retail media budget. It reports up through e-commerce. It gets measured on ROAS. And it never crosses paths with the brand team running CTV, the social team running awareness, or the CRM team thinking about loyalty.

That model is broken. And on May 11, 2026, Amazon made it official.

At its 2026 Upfront at the Beacon Theatre in New York, Amazon Ads put a single message in front of every agency buyer in the room: this is no longer a retail media platform. It’s a full-funnel commerce media ecosystem that spans streaming TV, live sports, Twitch, podcasts, creator content, Amazon DSP, and Amazon Marketing Cloud. All connected. All measurable. All sitting on the same authenticated identity graph.

If you work in health, beauty, nutrition, or any category where consumer trust matters more than impressions, what Amazon just announced changes how your media plan should look in 2027. Here’s what actually shifted, what the data says, and where I’d put my budget if I were rebuilding the plan from scratch.

What Amazon Actually Announced

The headline from the 2026 Upfront was a new product called Dynamic TV Creative. It’s the first capability inside Amazon’s Prime Video ad stack that automatically personalizes Interactive Video Ads based on a viewer’s shopping behavior and where they sit in the purchase funnel. Same ad asset. Different version. Adjusted at the moment of impression.

The way it works is straightforward. A viewer who has never seen the brand gets a standard awareness-style ad with a “learn more” call-to-action. A viewer whose shopping signals suggest purchase intent gets a different version with pricing, ratings, and an “add to cart” button. The product imagery, headline copy, and on-screen details all shift based on what Amazon’s authenticated graph knows about the viewer. It launched ahead of the Upfront for select U.S. advertisers in CPG, fashion, and electronics, with wider rollout planned for Q3 2026, including live sports.

That’s the new product. But the bigger story is the system around it.

higher brand search vs. standard streaming TV

more product detail page views

more add-to-cart actions

higher purchase rates

Source: Amazon Internal, Interactive Video Ads Incrementality Study 2025

Those numbers are the part that should make any digital director uncomfortable. They’re not benchmark lifts against a poorly run campaign. They’re lifts measured against standard streaming TV. The implication is clear: if you’re still buying CTV the old way, you’re leaving outcomes on the table that a competitor running the new format is collecting.

The authenticated graph at the center of everything

The product announcement matters. But what makes it work is Amazon’s authenticated graph, which the company says reaches 90% of U.S. households. Not modeled. Not panel-based. Authenticated through Amazon sign-ins, Fire TV registrations, Prime Video streaming, shopping behavior, and entertainment touchpoints.

Why does that matter for a health and nutrition brand? Two reasons.

First, frequency management actually works. In traditional CTV planning, you assume a household, you assume a demo, and you hope the frequency curve looks something like what you bought. With deterministic identity, you know who you reached, how many times, and what they did next. That’s a different kind of media plan.

Second, and this is the part I keep coming back to, the same graph that powers ad delivery also powers measurement inside Amazon Marketing Cloud. The exposure data, the shopping data, the conversion data, the repeat purchase data, the Subscribe & Save data. All in one clean room. For a category that gets evaluated on lifetime value and repeat behavior more than on a single conversion, that’s not a media improvement. That’s a customer engagement infrastructure upgrade.

The Amazon Full-Funnel Stack, 2026

AWARENESS Prime Video · Thursday Night Football · NBA · Twitch · Amazon Music · Podcasts

CONSIDERATION Amazon DSP · Online Video · Display Retargeting · Fire TV · Open Web

CONVERSION Sponsored Products · Sponsored Brands · PDP · Stores · A+ Content

LOYALTY Subscribe & Save · Repeat Purchase · AMC Audiences

AMAZON MARKETING CLOUD

One identity graph. One measurement layer. Connected across the funnel.

The full-funnel stack Amazon presented at its 2026 Upfront

Why This Matters More for Health and Nutrition Than for Snacks

Here’s where I think most analysis of the 2026 Upfront gets too generic. Amazon’s pitch applies to every category, but the value isn’t equal. For categories driven by impulse and shelf placement, the upper-funnel investment is a nice-to-have. For categories driven by consumer trust, education, and repeat purchase, the upper-funnel investment is the whole game.

And the data backs that up. eMarketer’s April 2026 industry KPI report shows retail media spend growth in health and beauty jumped more than 50% year-over-year, well ahead of every other category. That’s not happening because the category needs more retail ads. It’s happening because the brands inside the category figured out that retail media is where they can finally pair brand-building with measurable purchase outcomes.

What I tell my team is that in our category, three things are non-negotiable: trust, context, and proof. Amazon’s authenticated reach handles context. The measurement stack handles proof. Trust is something the brand has to earn through the content adjacency it chooses and the creative it puts out. The platform doesn’t do that part for you, but it gives you environments where it can actually happen. Trusted podcasts. Premium sports. Curated streaming. None of that existed inside the old retail media bucket.

“In our category, three things are non-negotiable: trust, context, and proof. Retail media used to handle one of them. Amazon’s full-funnel stack now handles all three.”

A Story from a Real Brand: Aveeno Baby

Case Study #1 · Health & Skincare

An emerging brand with no website. Nine weeks. Six million parents reached.

Aveeno Baby had a problem that should sound familiar to a lot of health and personal care brands trying to crack a new market. In India, the brand was still emerging. There was no owned e-commerce site. Sales lived inside Amazon. And the audience they cared about, parents of newborns to three-year-olds, was scattered across streaming services, social platforms, and third-party apps.

The team at Interactive Avenues didn’t run a search-only campaign. They didn’t run a display-only campaign. They built a full-funnel plan on Amazon DSP. A 15-second in-stream video to drive awareness. Static creatives and responsive digital ads across third-party apps to push consideration. All of it directed back to the best-selling Aveeno Baby product detail pages on Amazon.

Nine weeks later, the campaign had reached six million parents. Branded searches climbed 22%. The base of brand searchers and browsers grew sixfold. A Nielsen brand lift study measured an 11% increase in brand awareness among exposed audiences. And the total customer base for Aveeno Baby grew 18%.

The part I find most useful for our category isn’t the lift numbers. It’s the architecture. The shoppers who saw both ad formats, video and display, experienced an 8x increase in purchase rates compared to those exposed to a single format. That’s not a creative optimization. That’s a media architecture decision. Run one format and you get a fraction of the outcome. Run them together inside the same identity graph and the math changes completely.

The Second Story: H&R Block and Privacy-Safe Full-Funnel

Case Study #2 · Financial Services

A brand that doesn’t even sell on Amazon, doubling conversion through Amazon Ads.

I include this one specifically because the parallel to health and nutrition is closer than it looks. H&R Block doesn’t sell most of its products on Amazon. Neither do a lot of health brands that face channel complexity, compliance constraints, or partnership structures that limit what they can do on retailer platforms.

What H&R Block did was use Amazon Ads as a media and audience layer, not just a retail platform. They used Brand+ for AI-powered awareness across streaming TV and online video, including Prime Video. They used Performance+ for lower-funnel display and OLV. They built custom audiences inside Amazon Marketing Cloud and used hashed first-party data to keep everything privacy-safe.

The results from the 2025 tax season tell the story. Online video CPMs improved 26% year-over-year. Cost per acquisition improved 35%. Adding OLV to display alone drove a 47% lift in conversion rates. Adding Prime Video on top pushed that lift to 66%. And the full-funnel strategy more than doubled conversion rates compared to display-only campaigns, delivering a 144% total increase. Custom AMC audiences also delivered 62% more efficient CPA against the brand’s display average.

What’s the lesson for a regulated, compliance-heavy category like health and nutrition? You don’t need to live entirely inside Amazon to use Amazon as a full-funnel engine. The graph, the inventory, the measurement, and the audience-building tools are usable whether or not your primary checkout sits on the retailer’s platform. That’s a meaningful shift, and it opens the playbook for a lot of brands that have been told they don’t have an Amazon strategy because they don’t drive Amazon sales.

The Canadian Context (And Why It’s Already Different)

I write about the Canadian market a lot, so let me bring this home. The Amazon Upfront is a U.S. event. The product launches are U.S.-first. But the shift it signals is more advanced in Canada than most marketers realize.

According to eMarketer’s analysis, Canada ranks second in the world, behind only China, in retail media’s share of total digital ad spend. And the reason is Amazon. Amazon.ca’s dominance in Canadian e-commerce gives Amazon Ads a structurally larger share of the Canadian retail media market than it has in most other countries. Retail media spending in Canada will reach C$3.8 billion in 2026, and digital will account for 80.1% of total media ad spend.

What this means in practical terms is that a Canadian marketer who treats Amazon as a sponsored search bucket is mis-allocating against the realities of their own market. The full-funnel argument isn’t a future-state pitch in Canada. It’s already where the budget is moving.

Try It Yourself: The Full-Funnel Lift Calculator

What does a full-funnel approach actually do to your numbers?

Drag the sliders to model an Amazon DSP investment and see how a single-format plan compares to a full-funnel plan. The lift assumptions are based on the real H&R Block (144%) and Aveeno Baby (8x) case studies and the Interactive Video Ads incrementality study (5x purchase rate).


Estimated impressions (at $8 CPM)
6.25M
Conversions · Single-format strategy
312
Conversions · Full-funnel strategy
762
Revenue · Single-format
$14,063
Revenue · Full-funnel
$34,313
Incremental revenue gained
+$20,250

Illustrative model only. Real outcomes depend on category, creative quality, audience strategy, PDP readiness, and measurement methodology. Lift multipliers sourced from Amazon Ads case studies cited at the bottom of this article.

The Three Mistakes I See Most Often

1. Reporting Amazon on ROAS alone

If your Amazon scorecard ends at ROAS, your media plan is going to keep collapsing toward the bottom of the funnel. ROAS rewards harvesting demand. It does not reward creating demand. And in a category where the next purchase, the third purchase, and the Subscribe & Save renewal matter more than the first one, optimizing for ROAS will quietly starve your future growth. The H&R Block case study didn’t get published because of ROAS. It got published because the team measured cost per acquisition, conversion lift, frequency reduction, and AMC audience efficiency. That’s the scorecard.

2. Separating brand and retail budgets

This is the structural problem I see in almost every organization. The brand team owns Prime Video. The retail team owns Sponsored Products. The two budgets are planned separately, measured separately, and rarely talk to each other. Amazon’s pitch is that the funnel is one system. If you keep planning it as two systems, you don’t get the lift the platform is capable of delivering. According to Marketing Dive, the full-funnel campaigns offering launching this year is designed to unify sponsored ads, display, and streaming TV in a single agentic AI tool. That tells you where Amazon thinks the work should sit.

3. Scaling media before PDPs are ready

This one is the unsexy truth that nobody wants to put on a slide. Amazon media will not save a weak product detail page. If your images are mediocre, your copy is unclear, your reviews are thin, your claims are not properly substantiated, or your comparison story is confusing, scaling Prime Video spend on top of that will just deliver more shoppers to a page that doesn’t convert. I’ve seen this firsthand more times than I want to count. Fix the PDPs. Then scale the media.

What to Do Monday Morning

Five practical moves for the next 90 days

  • Run one full-funnel pilot. Pick one brand and one priority audience. Build a stack with streaming TV awareness, Amazon DSP retargeting, Sponsored Brands capture, and AMC measurement on top. Don’t pilot everything. Pilot one thing properly.
  • Rebuild the Amazon scorecard. Add reach, frequency, branded search lift, PDP views, first-time buyers, repeat purchase rate, and an LTV proxy. Keep ROAS as one metric among many, not the only one.
  • Set up an AMC learning agenda. Exposed versus non-exposed shoppers. First-time buyers. Branded search lift. Subscribe & Save renewal. These are CRM questions, not media questions, and AMC is built to answer them.
  • Audit your PDPs before you scale media. Images, claims, reviews, comparison content, subscription options. If the page isn’t ready, the media won’t carry it.
  • Pick your content context deliberately. Sports for active-living audiences. Premium streaming for adult education plays. Twitch for younger occasion-based brands. Trusted podcasts for high-consideration health stories. Inventory choice signals brand positioning. Don’t outsource the decision to a media plan.

The Bottom Line

Amazon’s 2026 Upfront wasn’t really about a single product launch. Dynamic TV Creative is interesting. The 6x and 5x lift numbers are interesting. But the actual signal is structural. Amazon is telling the market it has assembled the full stack: deterministic identity, premium video inventory, sports, audio, creator content, programmatic, retail conversion, and clean-room measurement. All inside one system. And it is openly betting that the brands willing to plan against that system as one connected funnel will out-grow the ones that don’t.

The brands that win this next phase won’t be the ones that spend more on Amazon. They’ll be the ones that stop treating Amazon like a checkout aisle and start treating it like what it is becoming: the most complete commerce media network in North America, with a measurement layer that finally lets you connect a Prime Video impression to a Subscribe & Save renewal eighteen months later.

That’s the part most playbooks haven’t caught up to yet. The brands that close that gap first are the ones I’d bet on.

GLP-1 and AI Search: What 4 Million Conversations From January 2026 Reveal About Your Patients

Digital Health & AI Search · 2026
4 million
AI conversations about GLP-1s in January 2026 alone — Scrunch AI research

More people asked AI about Ozempic, Wegovy, and semaglutide last month than asked about movies and TV shows. That’s not a trend. That’s a structural shift in how patients find, evaluate, and trust health information. And most pharma marketers are still building content for Google.

Let’s be honest about what’s happening here. The patient has changed. Not the biology, not the molecule, not the clinical outcome. The patient’s behaviour. Where they go to learn. What they ask. How long they stay. How they make decisions. And if your content strategy was designed for search engine results pages, you are building for the last channel.

Scrunch AI, a platform that tracks what people actually type into ChatGPT and other AI assistants, analysed millions of real GLP-1 conversations from January 2026. What they found is one of the most useful audience maps I’ve seen in years. Five distinct patient archetypes. Five different jobs to be done. And almost none of them are being served by how pharma brands currently produce content.

I want to walk you through those five archetypes, tell you what each one needs, and give you a clear picture of what a modern digital patient engagement strategy looks like in 2026.

4M
GLP-1 AI conversations in January 2026

5
Distinct patient archetypes identified by Scrunch

~20%
Active Evaluators — the highest-value switching segment

This Isn’t Search Optimization. It’s a Different Medium.

When someone types “Ozempic side effects” into Google, they’re looking for a page. When they type the same question into ChatGPT, they’re starting a conversation. And they come back. That’s the part most marketers miss.

Large language models don’t just answer questions. They build context across a session. A patient who starts by asking “how does Wegovy work” may ask three follow-up questions before they get to “is this covered by my insurance.” They move through awareness, comparison, access, side effects, and adherence support, all inside a single conversation. The funnel isn’t linear. It’s iterative.

In my experience, the brands that win in a channel like this aren’t the ones with the biggest media budget. They’re the ones whose content is structured in a way that AI can actually cite, quote, and recommend. That’s a different problem than SEO. And it requires a different kind of content investment.

Here’s what the Scrunch research tells us about who those patients actually are.

The Five GLP-1 Patient Archetypes in AI Search
Source: Scrunch AI research · January 2026 · Conversation share by archetype

4M convos analysed Jan 2026 Knowledge Seeker 24% Side Effect Navigator 23% Active Evaluator 20% Access Seeker 18% Regimen Planner 15%

The Five Archetypes. What Each One Actually Needs.

These aren’t demographic segments. They’re behavioural states. The same patient can move between archetypes as their journey evolves. Someone starts as a Knowledge Seeker, becomes an Active Evaluator after their doctor visit, then shifts to a Side Effect Navigator three weeks into treatment. What they need from your content changes at every stage.

24%
Top of Funnel
Knowledge Seeker

Curious but not committed. They’re asking broad questions: “What is Ozempic?” “How do GLP-1s work?” “Is Wegovy safe long term?” They haven’t talked to a doctor yet. They’re building a mental model. Your content here needs to educate without overwhelming, and build enough trust that they come back.

20%
Highest Switching Risk
Active Evaluator

Comparing options before a decision. Semaglutide vs tirzepatide. Ozempic vs Wegovy. Brand vs compounded. These users are most likely to switch brand intent based on a single piece of content. This is where comparative claims, real-world outcomes, and patient testimonials do the most work.

18%
Friction Removal
Access Seeker

They know what they want. They’re stuck on how to get it. “Is Ozempic covered by OHIP?” “How do I get a GLP-1 prescription in Canada?” “What’s the cost without insurance?” These questions are about access, cost, and eligibility. If your content doesn’t answer them, someone else’s will.

23%
Post-Purchase Retention
Side Effect Navigator

Already on the medication. Experiencing symptoms. Looking for reassurance, not product information. These patients are anxious and return to AI conversations repeatedly to check new symptoms. They need empathetic, medically grounded content that helps them stay on therapy, not drop off.

15%
High Lifetime Value
Regimen Planner

Above-median income. Highest return rate. They treat AI as an ongoing coach, asking iterative questions across multiple sessions about nutrition, exercise, injection timing, and long-term adherence. This archetype is a strong signal for tool-based and subscription content. What I tell my team is: if you’re not building something for Regimen Planners, you’re leaving your most engaged patients without a reason to stay loyal.

Conversation Share by Archetype
Source: Scrunch AI research · January 2026

Conversation Share

24% Knowledge Seeker

23% Side Effect Navigator

20% Active Evaluator

18% Access Seeker

15% Regimen Planner

The Canadian Context Makes This Even More Urgent

Here’s something that makes Canadian patients particularly active AI searchers: coverage in this country is a mess. Health Canada has approved GLP-1 medications for both diabetes and weight management, but provincial coverage rules are inconsistent. In Ontario, Ozempic is listed as a Limited Use drug. In Alberta, patients often need to try other treatments first. And as of January 2026, no provincial public drug plan covers Wegovy for weight loss.

That coverage complexity feeds directly into the Access Seeker archetype. Canadian patients aren’t just asking “does this work.” They’re asking “can I actually get it, and how much will it cost me.” Telus Health data shows weight-management drug spending has more than quadrupled since 2021, and the category grew 61% in 2025 alone. A generic version of Ozempic is expected in late 2026 at roughly 35% of current list price. That’s going to flood the market with new patients. But it doesn’t mean engagement becomes easier. It means the volume of questions gets higher.

From Telus Health’s 2026 Drug Pipeline Report: Weight-management drugs climbed six positions to rank #11 among all drug categories in Canada. The category grew 61% in 2025 after growing 104% in 2024. Two developments will drive further growth: Zepbound’s market entry and a generic Ozempic expected at roughly 35% of list price in late 2026.

Canadian Employer GLP-1 Drug Coverage Shift (2024 vs 2025)
Source: GLP-1 Drug Coverage Continues to Rise in Canada — Word on Benefits, 2025

2024 2025

66% — Diabetes only

17% — Both

56% — Diabetes only

31% — Both

Diabetes only coverage Both diabetes & weight loss Coverage for weight loss nearly doubled year over year. The patient base is expanding fast.

What Patients Are Actually Saying (In Their Own Words)

The Scrunch data gives us the archetypes. Reddit gives us the texture. Here’s what real GLP-1 users are saying in communities like r/Ozempic and r/WegovyWeightLoss, the exact language that then shows up in AI conversations.

r/Ozempic · Knowledge Seeker

“Just got prescribed Ozempic for my Type 2. I asked ChatGPT what to expect in the first month because I didn’t want to bother my doctor with what felt like basic questions. The AI was way more thorough than anything I found on Google.”

Via Reddit · r/Ozempic community discussions
r/WegovyWeightLoss · Side Effect Navigator

“Week 3 on Wegovy and the nausea is real. Went back to my Claude conversation three times this week asking about anti-nausea strategies and whether what I’m feeling is normal. Honestly it’s keeping me from quitting.”

Via Reddit · r/WegovyWeightLoss community discussions
r/diabetes_t2 · Access Seeker

“I’ve been trying to figure out how to get this covered under my group benefits in Ontario for two months. Finally asked ChatGPT to walk me through the appeal process step by step. Why isn’t this information on the drug company’s website?”

Via Reddit · r/diabetes_t2 community discussions

That last comment is a strategy brief, not a complaint. If a patient has to go to a general AI assistant to understand how to navigate your product’s access process, you have a content gap that someone will eventually fill.

What a Digital Marketer Should Actually Do With This

For Knowledge Seekers: Be the Source, Not the Result

These patients are building their first mental model of this category. They don’t need a product page. They need a clear, medically accurate explanation of how GLP-1 receptor agonists work, what to expect in the first few weeks, and what questions to ask their doctor. Content that’s structured for AI citation, with clean headers, concise factual statements, and linked sources, gets referenced in AI answers. Generic brand copy doesn’t.

For Active Evaluators: Own the Comparison

These patients will switch based on a single piece of content. They’re comparing efficacy, side effect profiles, cost, and format. If you don’t have a page that addresses those comparisons fairly and clearly, the AI will synthesise one from whatever it can find. And that might include your competitor’s positioning. Active Evaluators also respond to real patient outcomes, the kind that Reddit communities generate organically. You should be connecting to that conversation.

For Access Seekers: Solve the Access Problem in Detail

In Canada, this means province-by-province coverage guidance. It means walking someone through a private insurance appeal. It means explaining the difference between Limited Use criteria in Ontario versus special authorization in Alberta. This kind of content doesn’t get built because it’s not glamorous. But it’s the content that ends up cited in ChatGPT conversations.

For Side Effect Navigators: Retention Is a Content Strategy

Between 20% and 50% of patients stop GLP-1 therapy in the first year. A huge chunk of that discontinuation is driven by side effects that feel scary but are manageable. Side Effect Navigators want reassurance and practical guidance, not clinical disclaimers. Consider tools: an interactive side effect tracker, a symptom checker, a week-by-week guide to what’s normal. These aren’t nice-to-haves. They’re retention strategy.

For Regimen Planners: Build Something Worth Returning To

This archetype has above-median income and a high return rate. They treat AI as a coach. The content opportunity here is a tool, not an article. A meal planning guide that accounts for GLP-1-related appetite changes. An exercise protocol designed for patients on injectable therapies. A CRM journey that mirrors the iterative behaviour Scrunch documented. What I tell my team is: if a Regimen Planner finds your content once and it doesn’t give them a reason to come back, you’ve lost your highest-value patient.

Content Strategy by Patient Archetype — Journey Stage vs Engagement Depth
Matched to AI search behaviour

Patient Journey Stage → Engagement Depth →

Awareness Evaluation Access Treatment Adherence

Knowledge Seeker 24%

Active Evaluator 20%

Access Seeker 18%

Side Effect Navigator 23%

Regimen Planner 15%

The Real Problem Isn’t Content. It’s Infrastructure.

Here’s the uncomfortable truth for most pharma marketers. The five archetypes above each need different content, different formats, different channel strategies, and different measurement frameworks. But most pharmaceutical marketing organisations are built around campaigns, not customer journeys.

And the AI platforms are changing fast. OpenAI launched ChatGPT Health in January 2026. Anthropic followed with Claude for Healthcare four days later. Both now allow patients to connect their actual health records to AI conversations. The questions AI helps them ask will be far more specific than anything a search engine ever handled.

The brands that win will have built the content infrastructure before that shift fully hits. I’ve seen this firsthand in adjacent categories. The brands that invested in patient education content three years early are the ones that show up authoritatively in AI search today. It’s not luck. Search-optimised content from 2022 is now AI-citation-ready content in 2026. The same principle holds going forward.

5 Things to Do This Quarter

1
Map your content to the five archetypes. Start by auditing what you have. For most brands, 80% of content serves Knowledge Seekers. The other four are mostly empty.

2
Build a province-by-province coverage guide for Canada. This is the single highest-value content asset for Canadian Access Seekers. It doesn’t exist anywhere in clean, AI-citable form.

3
Structure your content for AI citation. Clear H2s. Short factual paragraphs. Named sources and statistics. Content that reads like a confident expert, not a regulatory filing.

4
Build one tool for Side Effect Navigators. An interactive week-by-week guide to what’s normal, with clear escalation criteria, would directly address the dropout risk in months one through three.

5
Start tracking AI search visibility. Platforms like Scrunch now track where your brand appears in AI-generated answers. If you’re not measuring it, you can’t improve it.

The Patient Hasn’t Changed. Their Expectations Have.

GLP-1 patients aren’t more demanding than any other patient population. But they’re operating in a category that moves fast, costs a lot, has real side effects, and has inconsistent access. And they’ve discovered that AI gives them faster, more thorough, more personalised answers than most branded healthcare websites.

That’s not a threat to your brand. It’s an invitation. Build content worth citing. Build tools worth returning to. Build journeys that match the iterative, non-linear way patients actually move through this category.

Four million conversations happened in January. The number will be higher in every month after. The question is how many of those conversations will reference your content, your guidance, your voice. Right now, most of them don’t. That’s the gap worth closing.

The Canadian Retail Media Opportunity You’re Ignoring

Canadian retailers are sitting on a goldmine of shopper data. Brands that figure this out first will win. Everyone else will keep guessing on Instagram.

By Franck Nlemba
April 2026
8 min read

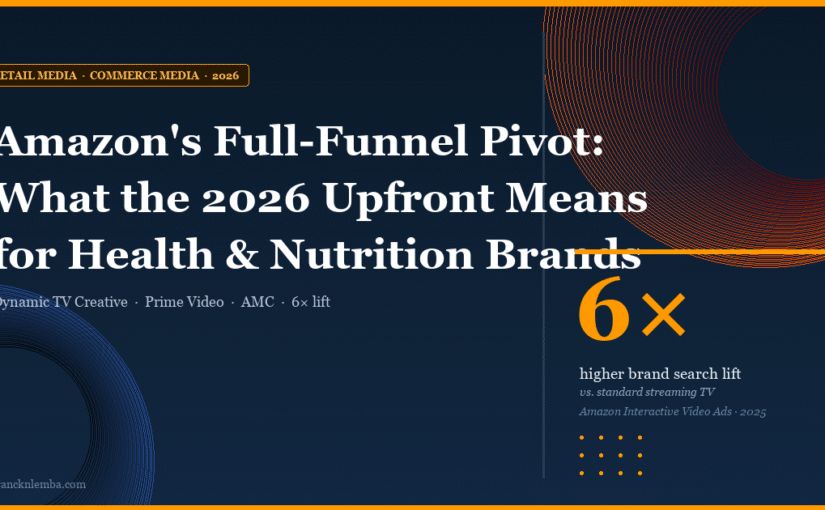
There’s a C$3.7 billion market in Canada that most brand marketers are still treating as an afterthought. Retail media. And if you’re still pouring the majority of your media budget into social platforms hoping the algorithm will show your ad to someone who might buy your product, we need to talk.

Here’s the truth. Social media platforms don’t know who actually bought your product. They know who clicked. They know who watched 3 seconds of your video. But they don’t know who walked into a Loblaws, picked up your SKU, and put it in their cart. Retailers do.

And that distinction changes everything about how you should be spending your money.

Retail media in Canada isn’t coming. It’s here. It’s growing at nearly 20% year over year. By 2028, it’ll be a C$6 billion channel. The question isn’t whether retail media matters. It’s whether you’re going to move fast enough to get the best positioning before your competitors do.

C$3.7B
Canadian retail media
ad spend in 2025
20%
Share of all digital
ad dollars
74%
North American marketers
increasing RMN spend

Sources: eMarketer Canada Retail Media 2025; Nielsen 2025 Annual Marketing Report (n=1,400 global marketers)

The Three Players You Need to Know

Canada’s retail media landscape isn’t as fragmented as the U.S. market. That’s actually good news. It means you can cover a massive portion of Canadian shoppers by working with three major networks. Each one offers something different.

Loblaw

Loblaw Advance
  • 18M+ PC Optimum members
  • 2,400+ retail stores
  • 1B+ yearly transactions
  • 11M+ unique monthly digital visitors
  • Closed-loop sales measurement
  • Multi-touch attribution (launched 2025)
  • In-store digital screens in 500+ locations

Walmart Canada

Walmart Connect Canada
  • #1 omnichannel retailer in Canada
  • Sponsored search + display on walmart.ca
  • Off-site targeting via DSP partners
  • In-store TV walls and self-checkout ads
  • AI-powered campaign optimization
  • Social integrations with Meta and TikTok
  • Self-service and managed campaigns

Amazon Canada

Amazon Ads
  • ~75% of Canadian retail media spend
  • Sponsored Products, Brands, and Display
  • Amazon DSP for off-platform targeting
  • Prime Video ads (CTV)
  • Deep purchase and browsing data
  • Most mature self-service tools
  • Full-funnel from awareness to conversion

Sources: Loblaw Advance official data; eMarketer Canada Retail Media 2024; Mars United Retail Media Report Card Canada, Spring 2025; Walmart Connect Canada


01

Why Brands Should Move Budget from Social Platforms to Retailers

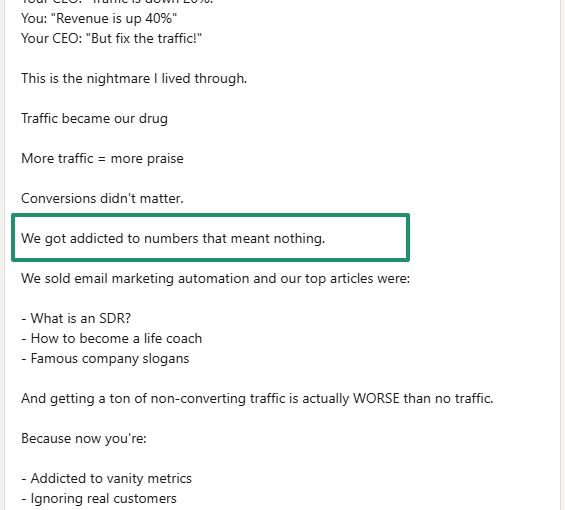
I’ve seen this firsthand. A CPG brand spends $500K on Instagram and Facebook over a quarter. The platform report says they reached 4 million people. Engagement rate looks healthy. The marketing team presents the numbers and everyone nods. But when you ask the simple question, “How many units did we actually sell from this campaign?” the room goes quiet.

That’s the gap. And it’s enormous.

The data problem with social media

Social platforms are built on interest signals. They know what you liked, what you commented on, what you scrolled past. But they don’t know what you bought at the grocery store last Tuesday. They can’t tell you whether the person who saw your ad is a loyal buyer of your competitor’s brand. They definitely can’t tell you if your campaign drove first-time buyers or just reminded existing customers to buy what they were going to buy anyway.

Retail media flips this on its head. When you run a campaign through Loblaw Advance, your ad is being served to people based on what they’ve actually purchased. Not what they “liked.” Not what hashtag they followed. What they put in their cart and paid for.

Let’s be honest

If 80% of consumer spending still happens in store (eMarketer, 2024), then why are 90% of your ad dollars going to platforms that can’t see inside a store? The math doesn’t add up.

Closed-loop measurement isn’t a buzzword. It’s the whole point.

When Nielsen surveyed 1,400 global marketers for their 2025 Annual Marketing Report, 65% said retail media networks would play a bigger role in their media strategy this year. In North America specifically, that number hit 74%. The reason? Closed-loop attribution. You spend money. The retailer tracks who saw your ad. Then they match it to actual in-store and online purchases. You get a real number. Not an estimated conversion. A real one.

Here’s what that looks like in practice with Loblaw Advance. They take the ad exposure data and match it against PC Optimum transaction records across 2,400+ stores. They can show you sales lift, return on ad spend, and whether you drove first-time buyers or increased basket size. No guesswork. No modelling. Actual receipts.

Walmart Connect does this too. Their first-party signals connect online ad exposure to both e-commerce and in-store purchases. And with 95% of shoppers who add items to their Walmart cart completing a purchase within a week, the intent signal is off the charts.

Social media vs. retail media: where your money works harder

Capability Social Media Retail Media
Targeting based on actual purchases
Closed-loop sales attribution
Measures in-store sales lift
First-time buyer tracking
Privacy-compliant first-party data Partial (declining)
Reaches shoppers at point of purchase
Upper-funnel brand awareness Growing (CTV, off-site)
Cost to reach verified buyers High (broad audiences) Lower (precision targeting)

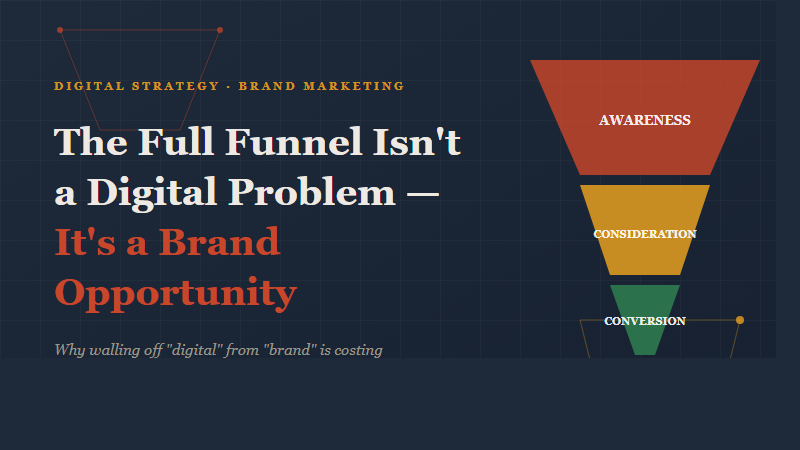
I’m not saying kill your social budget tomorrow. Social still does things retail media can’t, especially for broad awareness and community building. But if you’re a CPG brand spending 70% of your digital budget on Meta and TikTok and 5% on retail media, your allocation is backwards. In my experience, the brands getting the best results are running a 40/30/30 split: social for awareness, retail media for conversion and measurement, and search for intent capture.

“Customers who shop in-store and on PC Express spend about 26% more than customers who only shop in our stores. Speaking to the most valuable customers starts online.”
Lauren Steinberg, SVP Digital, Loyalty Media, Loblaw Companies

Real-World ExampleDanone Canada had a problem. A product recall on their plant-based milk cost them roughly 45,000 customers. Those shoppers didn’t just stop buying the product. They switched to competitors. And they were staying there.

Danone went to Loblaw Advance with one objective: win those people back. The Advance team used PC Optimum data to find exactly who those 45,000 lapsed customers were. They figured out what those shoppers were buying instead, whether they were premium or discount buyers, and how active they were on the app.

Then they built a targeted campaign: the right creative, the right offer, the right channel for each customer segment. The result? They didn’t just meet Danone’s recovery target. They beat it.

Try doing that with a Facebook lookalike audience.

Source: Grocery Business Magazine, “From App to Aisle: The Rise of Loblaw Advance,” December 2025

The cookie is crumbling. First-party data isn’t.

Here’s the other big shift. Third-party cookies are going away. Safari and Firefox already blocked them. Even though Google reversed its Chrome deprecation plan, consumer behavior has moved on. According to eMarketer, 38% of U.S. consumers accept cookies less frequently than they did three years ago. Privacy regulations in Canada, PIPEDA and its provincial counterparts, are getting stricter.

Social platforms are losing the targeting precision they once had. Apple’s ATT framework gutted Facebook’s ability to track conversions across apps. The signal loss is real, and it’s permanent.

Retailers don’t have this problem. Their data is first-party. It comes from loyalty programs, purchase transactions, and direct customer relationships. PC Optimum has 18 million+ members. That’s not a sample. That’s nearly half the country’s population. And every transaction is logged, permissioned, and tied to a real person.

What I tell my team is this: bet on the channel that owns its data, not the channel that’s borrowing someone else’s.


02

Why Brands Should Connect Their CRM to Retailers

This is the part most brands haven’t figured out yet. And honestly, it’s where the biggest competitive advantage sits right now.

Most brands have a CRM full of customer data. Email addresses, purchase history, engagement scores, subscription status. But that data sits in a silo. It tells you what happened on your own website or your own DTC channel. It can’t tell you what your customers are doing when they walk into a Walmart or shop on amazon.ca.

Now imagine connecting those two worlds.

Your Brand CRM
Emails, segments, purchase history

Data Clean Room
Privacy-safe matching

Retailer Data
In-store purchases, basket data

Activated Campaigns
Precision targeting + measurement

Data clean rooms make this possible (and legal)

In 2025, nearly 66% of organizations were using data clean rooms in some form for retail media. A clean room lets you upload your CRM data and match it against a retailer’s purchase data without either side seeing the other’s raw information. It’s privacy-compliant, it’s secure, and it answers questions you literally cannot answer any other way.

Questions like:

What a CRM + Retailer data connection unlocks

Are my DTC customers also buying from me at Loblaws? If yes, you’ve got a loyal cross-channel buyer. If no, there’s an expansion opportunity sitting right there.

Which of my CRM segments are showing up in competitor aisles? Your loyalty tier data combined with retailer category data can reveal defection patterns you’d never catch from your own data alone.

What does my customer’s full basket look like? Your CRM knows they buy your protein bars. The retailer knows they also buy almond milk, organic eggs, and pre-workout supplements. That’s a lifestyle profile you can’t build from email clicks.

The Loblaw Advance approach

Loblaw Advance can segment audiences by actual shopping behaviour: spend level, category mix, lifestyle signals, and purchase recency. They can tell you whether a customer’s last trip was a quick stock-up or a full weekly shop. They can distinguish between a premium beauty buyer and a discount grocery shopper, even when it’s the same person.

When Bell Media partnered with Loblaw Advance in late 2025, they created a closed-loop measurement solution for connected TV advertisers. The integration links Bell’s premium video inventory with Loblaw’s point-of-sale data. So a brand can run a CTV ad on Crave, then measure whether the people who saw it actually bought the product at a Loblaws store. That’s not a proxy metric. That’s proof.

And in September 2025, Loblaw Advance launched multi-touch attribution across their entire ecosystem. This means brands can now see how different touchpoints, from a sponsored product ad on the website to a PC Optimum offer on the app to an in-store digital screen, each contribute to a final purchase. One unified view. One source of truth.

Why “someday” is already too late

The brands that connect their CRM to retail media networks today are building a data asset that gets more valuable with every campaign. Every run teaches you more about your customers. Every match between your CRM and the retailer’s data sharpens your targeting. And every closed-loop result gives you the numbers to make the case for bigger budgets.

But there’s a first-mover advantage here. Clean room integrations take time to set up. Data matching requires alignment on taxonomies and identifiers. And once your competitor locks in preferred placements and custom audiences with a retailer, you’re fighting uphill.

According to eMarketer, 58% of U.S. ad buyers are prioritizing first-party data partnerships in 2025. In Canada, that trend is accelerating. The Mars United Retail Media Report Card rated nine Canadian networks across 99 performance criteria. The ones that scored highest? The ones investing most heavily in making it easier for brands to bring their own data to the table.


The Budget Shift: Where Smart Brands Are Moving

YESTERDAY’S MODEL

Meta / Facebook — 40%

Instagram — 30%

YouTube — 20%

TikTok 10%

Can’t measure real sales


TOMORROW’S MODEL

Retail Media — 40%

Social — 30%

Search — 20%

CTV 10%

Every dollar tied to a receipt


Illustrative budget allocation for Canadian CPG brands

The Bottom Line for Canadian Brands

Retail media in Canada is growing faster than any other digital ad channel. The 19.7% growth rate in 2025 was more than double the 8.8% growth in overall digital advertising. And over the five-year span leading to 2028, eMarketer forecasts a 134% gain in the channel overall.

The three retailers that matter most, Loblaws, Walmart, and Amazon, aren’t just selling ad space. They’re selling access to verified purchasers. They’re selling closed-loop measurement. They’re selling something social platforms simply can’t offer: proof that your ad drove a sale.

And when you connect your CRM to these networks, you stop marketing to personas and start marketing to real people. People whose purchase behaviour you can actually see, measure, and act on.

Three things to do this quarter

1. Audit your current spend. If retail media is under 15% of your digital budget, you’re underweight for a CPG brand in Canada.

2. Start a clean room pilot. Pick one retailer. Match your CRM. See what you learn. The insights will justify the investment.

3. Shift 10-15% of your social budget into retail media. Keep social for what it does best (awareness and community). Let retail media handle the work that matters most: proving that your advertising actually sells product.

Data Sources

  1. eMarketer, “Canada Retail Media 2025,” February 2025
  2. eMarketer, “Canada Retail Media 2024,” January 2024
  3. eMarketer, “Retail Media is the Fastest-Growing Digital Advertising Channel at Scale in Canada,” February 2025
  4. Nielsen, “2025 Annual Marketing Report: From Chaos to Clarity,” May 2025 (n=1,400 global marketers)
  5. Nielsen, “The Future of Retail Media,” June 2025
  6. Mars United Commerce, “Retail Media Report Card Canada, Spring 2025”
  7. Loblaw Advance official data and press releases (loblawadvance.ca)
  8. Bell Media & Loblaw Advance partnership announcement, December 2025
  9. Loblaw Advance, “Multi-Touch Attribution Launch,” September 2025
  10. Grocery Business Magazine, “From App to Aisle: The Rise of Loblaw Advance,” December 2025
  11. Grand View Research, “Canada Retail Media Networks Market Size & Outlook, 2030”
  12. Walmart Connect Canada (walmartconnect.ca)
  13. ResearchAndMarkets / GlobeNewsWire, “Canada Digital Ad Spend Business Report 2026,” February 2026
  14. eMarketer, “Walmart Connect Expands Social Capabilities,” April 2026
  15. Wilkins Media, “The 2026 Canadian Marketing Trend Report,” March 2026
  16. AI Digital, “Retail Media Networks: How They Work in 2026,” February 2026

The Full Funnel Isn’t a Digital Problem — It’s a Brand Opportunity

Digital Strategy · Brand Marketing · Retail Media

Why splitting “digital” from “brand” is costing companies sales they never knew they lost — and how to fix it.


I’ve been in this meeting more times than I can count. Someone looks at the digital spend line and says, “You’re putting money into retail ads. That only drives online sales.” It sounds logical. It feels reasonable. It’s also wrong. And the cost of believing it shows up in your numbers.

I know because I’m in that conversation every week. As a digital director, I spend a lot of time fighting a false divide: brand marketing on one side, digital performance on the other. This piece is my attempt to close it. With actual evidence.

THE PURCHASE FUNNEL IS ONE JOURNEY, NOT THREE DEPARTMENTS AWARENESS TV · OOH · RETAIL MEDIA DISPLAY · SPONSORSHIPS CONSIDERATION SEARCH · SOCIAL · EMAIL · SPONSORED PRODUCTS CONVERSION PDP · CART · CHECKOUT · IN-STORE AISLE BRAND TERRITORY DIGITAL TERRITORY RETAIL MEDIA
Retail media gets dismissed as a bottom-of-funnel tool. It isn’t. It runs all three stages at once.

The Funnel Was Never Separate Channels

The purchase funnel was always a metaphor. Awareness at the top, consideration in the middle, conversion at the bottom. Simple enough. But then organizations did something the textbooks never intended: they built actual departments around those stages. Brand owned the top. Performance owned the bottom. And the middle? Nobody owned the middle.

The result is a mess. Brand budgets lost their connection to real outcomes. Performance budgets lost any sense of long-term equity. And digital, a channel that runs across all three stages at the same time, got shoved into the “performance only” bucket. Even when the data said otherwise.

“Digital media isn’t where brand goes to die. It’s where brand goes to prove it’s working.”
— The argument the industry keeps resisting

Retail Media Is Brand Media. Full Stop.

Take Walmart.ca. A brand runs a sponsored product or a display ad in that environment, and the instinct is to call it a sales move. You’re catching shoppers mid-browse and nudging them to convert. Sure, that’s one thing it does. But it isn’t the only thing. Not even close.

A shopper sees your brand at the top of a Walmart.ca search. They don’t buy. They browse, compare, and close the tab. You might call that a wasted impression. I’d call it a seeded consideration. That person just saw your brand in a high-trust environment. Walmart’s credibility rubbed off on yours. And the next time they’re standing in the aisle, that exposure is still working.

THE WALMART.CA SHOPPER JOURNEY — WHERE DOES THE DIGITAL AD ACTUALLY END? 🛒 Browses Walmart.ca High-intent environment TOUCHPOINT 1

📣 Sees Your Sponsored Ad Brand impression in trusted context BRAND EXPOSURE

💭 Doesn’t Buy — Yet Memory encoded. Brand recalled later CONSIDERATION

🏪 Buys In-Store or Returns Online 60% of retail media impressions end here (Criteo, 2023) CONVERSION — ANYWHERE

The “digital spend” critics say only drives online sales — drives the sale regardless of where it happens.

Leaving without buying doesn’t mean the ad failed. That shopper carries your brand into the next store they walk into.

Case Study

L’Oréal Canada — Retail Media as Brand Builder

L’Oréal had a problem a lot of brands recognize: getting noticed in a crowded Canadian market, both online and off. They ran a campaign that blended retail ads with brand placements across e-commerce and physical stores. Shoppers who saw the digital component showed a 22% lift in brand recall compared to those who didn’t. Even among people who bought nothing. The following quarter, first-time buyers showed up in physical stores too. The digital placement wasn’t closing deals. It was opening doors.

The Numbers That Should End This Debate

70%of purchase decisions influenced by digital touchpoints before in-store purchase (Google/Ipsos)
3.5×higher conversion when brand awareness precedes performance media exposure (Nielsen)
60%of retail media impressions end in an in-store purchase, not online (Criteo)
$45Bprojected retail media ad spend in North America by 2026 — driven largely by brand goals (eMarketer)

Stop at that third number. Sixty percent of retail ads end in an in-store purchase. Not online. In the store. So when someone tells you digital spend only moves the needle online, they’re dismissing the majority of what they’re actually paying for. That’s not a rounding error. That’s the whole story.

The Real Problem: Brand Has Been Diluted Into Digital

Here’s the truth. Over the past decade, brand budgets didn’t disappear. They moved. Under pressure to justify every dollar, CMOs pulled money out of TV, print, and OOH and pushed it into programmatic, paid social, and search. They called it efficiency. What actually happened is that brand thinking got stripped out of those investments. The channel changed. The strategy didn’t follow.

HOW BRAND THINKING LEFT THE BUILDING (2005–2025) 2005 2010 2015 2020 2025 Brand Equity Score Digital Ad Spend Spend ↑, equity ↓ Brand thinking diluted P&G cuts $200M 2017 — rebuilds with brand-first intent Brand equity Digital ad spend Conceptual illustration based on industry-wide trend data (Binet & Field, 2019; Nielsen CMO Report)
Digital spend went up. Brand equity went down. Not because digital doesn’t work. Because nobody brought the brand thinking with them when they made the move.
“We didn’t move brand into digital. We replaced brand with digital, and then wondered why our awareness scores were flat.”
— A pattern repeated across virtually every major CPG category

Case Study

P&G’s Reversal — A Lesson in Reclaiming Brand Within Digital

In 2017, P&G made headlines by cutting $200M in digital spend. Too narrow. Too targeted. Diminishing returns. Two years later, they came back quietly. But the briefs were different this time: brand-first creative, longer formats, awareness objectives written in from day one. By 2019, they posted 7% organic sales growth and brand equity scores were climbing. What changed wasn’t the channel. It was the thinking they brought to it.

New-to-Brand Is a Digital KPI. It Should Be a Brand KPI Too.

Amazon, Walmart Connect, Kroger Precision Marketing: they all show you natively how many of your sales came from first-time buyers. Not modeled. Not inferred. Actual people who had never bought your brand before. That’s brand acquisition. Sitting in your dashboard right now.

RETAIL MEDIA NATIVE BRAND METRICS — LIVE IN YOUR DASHBOARD NEW-TO-BRAND SALES 68% ↑ +18pp vs. prior period BRAND ACQUISITION KPI

BRAND RECALL LIFT +22% vs. unexposed shoppers AWARENESS KPI

IN-STORE VELOCITY +14% 4 weeks post-campaign OFFLINE IMPACT KPI

REPEAT PURCHASE AFTER 1ST EXPOSURE 2.3× vs. non-exposed baseline LOYALTY KPI

These metrics live natively inside Walmart Connect, Amazon DSP, and Kroger 84.51° — they are brand metrics inside a digital platform. Brand acquisition is now measurable in real time. The excuse “we can’t prove brand ROI” no longer applies.

These aren’t vanity metrics from a third-party study. They live inside the same dashboard as your ROAS. Brand KPIs and performance KPIs, side by side.

Case Study

A Mid-Sized Canadian Snack Brand on Walmart Connect

A snack brand nobody had heard of wanted to break into Walmart. They had six weeks and a modest budget. Here’s what happened. They ran sponsored products and display ads on Walmart.ca, targeting shoppers who’d never bought their brand before. Of total campaign sales, 68% came from first-time buyers. And in the four weeks after it ended, in-store sales at Walmart locations climbed 14%. People had seen the brand online and gone looking for it on the shelf. That’s not a digital campaign. That’s a brand-building campaign that happened to run digitally.

How to Fix the Conversation Inside Your Organization

Key Principles for Digital Directors Navigating This Debate

  1. Stop defending the channel. Start reporting on outcomes. Don’t show up to brand reviews talking about CTRs and ROAS. Show up with awareness lift, consideration scores, and first-time buyer rates. The moment brand KPIs appear in a digital report, the conversation changes.
  2. Show the in-store halo. Every time. Pull the geo-level store data that lines up with your digital campaign windows. In my experience, the lift is almost always there. Brick-and-mortar sales follow digital reach far more consistently than brand teams are willing to admit.
  3. Brand goes in the brief. Not in the post-mortem. What I tell my team: every digital placement needs to carry a brand idea, even if it’s a banner. A Walmart.ca ad should feel like the same brand as your TV spot. Smaller canvas, same idea.
  4. Use the platform’s own data to make the case. First-time buyer metrics, category share of voice, repeat purchase rate after first exposure: these live inside Walmart Connect, Amazon DSP, and Kroger 84.51°. Bring them to your brand reviews. Let them do the talking.
  5. The 60/40 rule isn’t just for traditional media. Binet & Field are clear: roughly 60% of investment should go toward long-term brand building, 40% toward short-term conversion. Digital can serve both halves. But only if the objectives are set that way from the start.

THE BINET & FIELD 60/40 PRINCIPLE — APPLIED TO DIGITAL 60% — LONG-TERM BRAND BUILDING TV · OOH · Retail Media Display · Brand-Led Digital Video · Sponsorships 40% — SHORT-TERM ACTIVATION Sponsored Products · Search · Promotions · Retargeting ← Digital serves BOTH bars, when briefed with the right intent Source: Binet & Field, “The Long and the Short of It”, IPA — still the most cited marketing effectiveness framework
60/40 isn’t anti-digital. It’s a framework. And digital can serve both halves of it, if you brief it that way.

The Opportunity Nobody Is Claiming

Here’s the opportunity nobody’s talking about. The most underused person in marketing today isn’t someone with a new technical skill. It’s someone who speaks both brand and digital fluently. Most organizations have split these disciplines so far apart that a person who can actually bridge them is rare. And genuinely hard to replace.

Full-funnel thinking isn’t empire-building. It’s just paying attention. Shoppers don’t turn off brand awareness when they open a browser. They don’t skip a Walmart.ca ad because they’re planning to buy in store. The journey is seamless on their end. Our media plans are the ones with all the walls in them. And that’s the problem we need to fix.

The marketing director who’s skeptical of digital isn’t irrational. They’ve watched a decade of spend get poorly explained and even more poorly measured. That skepticism is earned. But the answer isn’t to split the disciplines further apart. It’s to build a shared language for what brand success actually looks like, wherever it happens.


The full funnel isn’t a digital problem. It’s a brand opportunity that happens to live in digital spaces. The organizations that figure that out first won’t just win online. They’ll win in every aisle, on every shelf, in every market where their customers are making decisions. Which, these days, is everywhere.

Beyond Traffic: Why Chasing Visitors Won’t Necessarily Boost Your Bottom Line

Many entrepreneurs equate website traffic with success. The logic seems straightforward: more visitors should mean more customers and higher sales. But in reality, high traffic does not guarantee high sales – especially when conversion rates are abysmally low. In fact, average website conversion rates hover around just 1–3%, meaning roughly 98 out of 100 visitors take no actionwordstream.comwordstream.com.

This conversion gap indicates that most traffic is merely window shopping. At the same time, the cost to acquire that traffic has been rising sharply, eating into marketing ROI. Paradoxically, some businesses are now seeing less traffic but more sales – a trend that challenges long-held assumptions about digital growth.

In this report, we’ll explore why focusing solely on traffic acquisition can be a costly mistake. We’ll back this up with data – from low global conversion rates to surging customer acquisition costs – and highlight insights from industry leaders (like Rand Fishkin) who observe that declining traffic can coincide with rising revenue. We’ll examine real examples (e.g. HubSpot’s recent experience) and the changing landscape of search, where Google’s AI summaries and “zero-click” results often bypass websites altogether. 

The 2% Reality: Traffic Without Conversions

For most websites, only a tiny fraction of visitors ever convert into customers or leads. Numerous studies put average conversion rates in the low single digits. For example, WordStream data shows the average e-commerce conversion rate is about 1.91%. Similarly, industry benchmark reports find median conversion rates around 1–2% in many sectors (e.g. median fashion retail conversion ~1.96%). In other words, over 98% of web visitors typically don’t buy or sign up.

Such low conversion efficiency means that pouring more and more people into the top of the funnel yields diminishing returns. If only 2 in 100 visitors make a purchase, getting 1,000 more visitors might only produce 20 sales – and that’s if they are quality visits. As marketing expert Brendan Hufford observed, chasing big traffic numbers often leads to a false sense of success. He recounted a “nightmare” scenario where vanity metrics took over: his team celebrated spikes in blog hits even though those visits (to articles like “What is an SDR?” and “How to become a life coach”) were largely irrelevant to their product and converted no one.

They became “addicted to numbers that meant nothing,” ultimately optimizing for pageviews instead of paying customers.

This cautionary tale underscores that more traffic can be worse than no traffic at all if it’s untargeted – it wastes resources and attention on people who will never buy, while distorting your KPIs.

Brendan HuffordBrendan Hufford Linkedin Post

In short, a big Google Analytics session count is not a business goal – sales and leads are. If your conversion rate is 1%, doubling traffic might double your problems (server costs, bounce rates, irrelevant inquiries) without meaningfully moving revenue.

Rather than fixate on filling the funnel, smart entrepreneurs assess how well their website persuades visitors. Increasing the conversion rate from 1% to 2% is far more impactful than increasing traffic by another thousand hits. The data makes it clear: traffic for traffic’s sake is a dead end if those visitors aren’t taking action.

Rising Customer Acquisition Costs (CAC) Squeeze ROI

Not only do most visitors not convert – getting those visitors is becoming more expensive. Digital marketers have watched the cost of customer acquisition climb year after year, especially in paid channels. Recent benchmarks illustrate this trend starkly. According to 2024 Google Ads industry data, the average cost per click (CPC) rose to about $4.66up ~10% from $4.22 the year prior (and higher than ~$4.01 in 2022).

More importantly, the average cost per lead (CPL) has ballooned: by late 2023 it averaged $66.69 across industries, a 25% increase from the year before (Just two years earlier, in 2022, the average CPL was around $44, implying roughly 50% higher lead acquisition costs now than in 2022.

To put these numbers in perspective, below is a summary of recent cost trends for Google search advertising:

Average Google Ads Costs (All Industries)linkedin.com

Metric2022 Average2023 Average2024 Average
Cost per Click (CPC)$4.01$4.22$4.66
Cost per Lead (CPL)$44.70$53.52$66.69

Table: Steady rise in paid search costs from 2022–2024 (data from LocaliQ/WordStream benchmark report)linkedin.com.

This means marketers are paying more for each visitor and each lead than ever before. If your website’s conversion rate isn’t improving in tandem, your cost to acquire a customer (CAC) is shooting up.

For example, if it cost $50 in ads to get one purchase last year, it might cost $60–$70 now for the same outcome. Indeed, a search ad trends report noted CPLs rose in the majority of industries (+25% on average) even as conversion rates declined in many sectors. The result is a pincer movement on ROI: higher ad spend yielding fewer conversions.

Meanwhile, platforms like Google are reporting record profits, indicating that advertisers are pouring in budgets to compete for clicks. Competition drives up bids, and automation (like Google’s automated bidding) often skews toward higher spends.

 A 2024 analysis found Google’s search ad costs had surged 133% year-over-year in some cases, with certain retail sectors experiencing a 40–50% increase in ad prices over five yearsbubbleup.net. These increases far outstrip inflation, reflecting how much costlier it has become to simply maintain the same traffic levels via paid acquisition.

The takeaway for entrepreneurs is sobering: buying traffic is an increasingly expensive game. If you’re dumping more budget into Google or social ads expecting to fuel growth, be aware that the efficiency of that spend is likely diminishing. When clicks cost dollars and most clicks don’t convert, chasing traffic can burn through cash fast. This is why many marketing leaders now emphasize improving conversion and customer value over just driving more visits. As we’ll discuss, investing in understanding your audience and tailoring your offer can yield better ROI than blindly upping ad spend to hit vanity traffic goals.

Traffic Down, Revenue Up: Decoupling Visits from Sales

For decades, we assumed a strong positive correlation between website traffic and sales – more visitors in the funnel meant more buyers out the other end. Recently, however, a “deeply strange trend” has emerged where the two have become unbound. In example after example, businesses are reporting situations where traffic is falling but revenue is rising. This isn’t a fluke; it’s a sign of changing user behavior and marketing effectiveness beyond raw clicks.

Perhaps the most prominent case is HubSpot. The popular B2B software company saw a dramatic drop in its blog traffic in 2023–2024 – losing millions of monthly Google visits. An analysis estimated HubSpot’s organic blog traffic fell on the order of 50–80%, from around 13 million visits at its peak down to a few million in late 2024. Yet, in that same period, HubSpot’s business thrived. HubSpot’s annual revenue grew ~22% year-over-year to reach about $2.5 billion in 2024 with strong gains in customer count and an all-time high stock price.

How is this possible?

It seems that much of the lost traffic was to top-of-funnel blog posts (e.g. generic how-tos and definitional articles) that weren’t directly tied to their core products’ purchase intent.  In other words, HubSpot’s SEO team had built massive traffic on broadly popular topics, but those visitors were largely non-buyers. When Google’s algorithm later redirected those informational queries to sites like Canva, Wikipedia, or others HubSpot’s visitor numbers dropped – yet their real customers still found them through other means. The people who genuinely needed HubSpot’s software were now discovering it via brand reputation, word-of-mouth, and targeted content, rather than through random blog hits. 

Moving Beyond Traffic: What To Focus on Instead

If not traffic, what should growth-minded businesses concentrate on? Below are key strategies – each a more sustainable driver of revenue than raw traffic numbers:

  • Understand Your Audience’s Behavior : Invest in market research and audience insights. Learn who your best customers are, where they spend time, and what truly motivates them. This could mean using tools to analyze audience demographics and interests, conducting surveys/interviews, or engaging in online communities to observe discussions. The goal is to meet your audience on their terms. By understanding their behavior, you can position your marketing where it actually resonates.  When you know what your customers care about, you can create content and offers that naturally attract them (often without needing massive ad spend). This customer-centric approach ensures you’re driving quality visits the kind that convert; instead of chasing everyone and hoping someone is interested.

These social networks are used more/less than the global average by people with mom in their profile in Canada:

  • Improve Offer–Audience Fit (Conversion Optimization, rather than throwing more prospects at a mediocre offer, make your offer more compelling to those who are already finding you. This is essentially conversion rate optimization and product-market fit alignment. Analyze why the 98% aren’t converting: Is it the messaging? The pricing? By addressing objections, you can lift your conversion rate (even modest gains from 1% to 2% double your sales with the same traffic). Ensure that your marketing promises align with the experience on your site. Remove friction from the user journey. It’s also about targeting: if you attract a slightly smaller but more qualified audience, your conversion rate will improve.

  • Offer-audience fit means the right people seeing the right message. When you achieve that, you need not worry about pouring in huge volumes of traffic; the business scales efficiently because a larger share of visitors say “yes.” 

  • Leverage Local Marketing. For businesses with any local or regional component, local marketing can be a high-conversion alternative to broad online traffic. This includes local SEO (optimizing for “near me” searches, Google Maps, etc.), community involvement, and offline-online integration. Ensuring your Google Business profile is robust, encouraging reviews, and appearing in local directories can drive ready-to-buy customers straight to your door (or website). Additionally, sponsoring local events or partnering with local organizations can boost word-of-mouth. 

  • Embrace Event Marketing and Direct Engagement. In-person and virtual events (webinars, workshops, conferences, meetups) can cultivate deeper relationships with prospects than a drive-by website visit. Events have a way of attracting highly interested audiences and immersing them in your brand or product experience.  Whether it’s hosting a live webinar or networking at a trade show, events create opportunities for dialogue, trust-building, and immediate feedback that static web traffic cannot match. Even smaller-scale events like roundtable discussions or AMA (Ask Me Anything) sessions can yield a rich crop of leads.

  • Build Your Brand with Content & Storytelling – Instead of churning out SEO-optimized posts for traffic, shift to brand content that tells a story and builds an emotional connection. Strong branding and storytelling increase customer loyalty and willingness to buy. Focus on creating content that conveys your mission, showcases customer success stories, and provides genuine value. This might be thought leadership articles, video series, podcasts, or social media narratives formats that may not always go viral in terms of traffic, but engage the right people and differentiate your brand. Good storytelling also spreads via word-of-mouth. When people feel a connection to your brand, they become ambassadors, mentioning you in conversations (online and offline).

Over time, a strong brand reduces your reliance on paid traffic, as customers come to you proactively because they trust what you stand for.

In practical terms, this means allocate resources to content marketing, PR, and social media presence that reinforce your story, rather than just running another lead-gen campaign. Brand equity might be hard to measure in Google Analytics, but it shows up in the bank balance through higher conversion rates, repeat business, and resilience to competition.

Franck NLEMBA


Sources:

  • Fishkin, R. “Traffic Is Down; Revenue Is… Up?” SparkToro Blog. Jan 27, 2025 sparktoro.com

  • Reynolds, W. “Why 2020’s SEO KPIs Won’t Work in 2024…” Seer Interactive. Sep 23, 2024seerinteractive

  • Ad Costs: LocaliQ (via Search Engine Journal) 2024 Google Ads Benchmarks linkedin.com; BubbleUp Marketing, Oct 24, 2024. bubbleup.net.

  • Local Search Stat: Think with Google, 2019 report on local search behavior. lionssharedm.com.
  • Event Marketing ROI: Splash survey via ExplodingTopics, 2023. explodingtopics.com.

  • Brand Storytelling Stats: CXL 2023 via HuddleCreative. huddlecreative.com.

Au-delà du trafic : pourquoi courir après les visiteurs ne boostera pas forcément votre résultat net

De nombreux entrepreneurs associent le trafic d’un site web à la réussite. La logique semble simple : plus de visiteurs devraient signifier plus de clients et des ventes accrues.

Pourtant, un trafic élevé ne garantit pas un chiffre d’affaires important; notamment quand les taux de conversion sont très faibles. En effet, les taux de conversion moyens se situent autour de 1 % à 3 %, ce qui signifie qu’environ 98 visiteurs sur 100 ne réalisent aucune action utile pour l’entreprise.

Cette faille de conversion suggère que la plupart des visites relèvent de la simple consultation. Parallèlement, le coût pour acquérir ce trafic a fortement augmenté, réduisant la rentabilité des campagnes. Fait paradoxal, certaines entreprises observent désormais une baisse de trafic tout en voyant leurs ventes progresser.  Ce phénomène remet en cause les idées reçues sur la croissance digitale.

Prenons l’exemple de la fête des mères au Canada. Le marketeur de base pour attirer des ventes en ligne aura coutume de regarder les mots clés les plus recherchés. Il va utiliser des outils de recherche de mots clés. Mais très rarement il va considérer YouTube, Reddit, Quora ou même Pinterest dans les plateformes à analyser. Et pourtant une analyse sur un échantillon de 5K personnes au Canada démontre bien que ces plateformes sont populaires auprès des mamans.

These social networks are used more/less than the global average by people with mom in their profile in Canada:
These social networks are used more/less than the global average by people with mom in their profile in Canada

Tout comme il ne va certainement pas réaliser que la mise a jour des conditions de livraisons sur les pages de produit est probablement l’action la plus importante pour la conversion!

These topics are highly relevant to searchers for mother day gift in Canada:

La réalité des 2 % : un trafic sans conversions

Pour la plupart des sites, seule une infime fraction des visiteurs se transforme en clients ou en prospects qualifiés. Plusieurs études placent les taux de conversion moyens en dessous de 3 %. Par exemple, WordStream indique que le taux de conversion moyen du e-commerce est d’environ 1,91 %. De même, des rapports sectoriels font état de taux de conversion médian autour de 1–2 % dans de nombreux domaines (p. ex. mode : ~1,96 %).

L’erreur classique est de célébrer les pics de trafic même lorsque ces visites n’ont aucun lien avec votre offre. Comme l’a relaté Brendan Hufford, son équipe est devenue « accro à des chiffres qui ne signifiaient rien » :

ils se félicitaient d’articles génériques (« Qu’est-ce qu’un SDR ? », « Comment devenir coach de vie ? ») qui drainaient beaucoup de visites… mais aucun acheteur. Ils optimisaient pour des pages vues au lieu de vrais clients, gaspillant temps et budget sur un trafic peu qualifié.

 Brendan HuffordBrendan Hufford Linkedin Post

Si votre taux de conversion est de 1 %, doubler votre trafic ne fera peut-être que doubler votre coût sans doubler vos ventes. Avant de chercher plus de visiteurs, assurez-vous que votre site sait convertir ceux que vous avez déjà.

Augmentation des coûts d’acquisition client (CAC) et pression sur le ROI

Acquérir du trafic devient également plus onéreux. Entre 2022 et 2024, les coûts des campagnes Google Ads ont flambé :

MétriqueMoyenne 2022Moyenne 2023Moyenne 2024
Coût par clic (CPC)4,01 $4,22 $4,66 $
Coût par prospect (CPL)44,70 $53,52 $66,69 $

Tableau : augmentation régulière des coûts de recherche payante de 2022 à 2024 (données LocaliQ/WordStream).

Résultat : vous payez plus pour chaque visiteur et chaque lead. Si votre taux de conversion n’augmente pas également, votre coût d’acquisition client s’envole.

Par exemple, un achat qui coûtait 50 $ en publicité peut désormais coûter 60–70 $. Et alors que Google affiche des bénéfices record, votre budget se dilue dans la concurrence des enchères automatiques et des CPC à la hausse. En savoir plus sur l’inflation des coûts publicitaires ici

Trafic en baisse, chiffre d’affaires en hausse : dissocier visites et ventes

Il se produit aujourd’hui un phénomène étrange : certaines entreprises voient leur trafic chuter tout en voyant leurs revenus grimper. Le cas le plus emblématique est HubSpot :

  • Entre 2023 et 2024, HubSpot a perdu des millions de visites mensuelles organiques sur son blog (– 50 % à – 80 % selon Ahrefs).
  • Pourtant, sur la même période, son chiffre d’affaires annuel a cru de ~22 % pour atteindre 2,5 milliards de dollars en 2024, avec un nombre de clients au plus haut historique et une action en bourse en progression constante.

Comment l’expliquer ? HubSpot a d’abord construit énormément de trafic sur des articles génériques, peu liés à l’intention d’achat. Quand Google a redirigé ces requêtes vers des sources plus spécialisées (Canva, Wikipédia…), HubSpot a perdu ces visites « vanity » sans que cela n’impacte ses ventes réelles. Or, les acheteurs ayant une intention claire trouvent toujours HubSpot par sa réputation, le bouche-à-oreille ou son contenu ciblé.

Ils ne sont pas seuls : Wil Reynolds (Seer Interactive) observe que son trafic Google en 2024 est 41 % en dessous de son pic de 2020, sans pour autant voir s’effondrer ses leads ni son chiffre d’affaires. Comme le rappelle Rand Fishkin,

« l’influence, pas le trafic, doit devenir la métrique principale » dans ce nouveau contexte.

Le nouveau paysage numérique : réponses IA et recherches sans clic

La dissociation trafic/ventes s’explique par les évolutions des comportements de recherche :

  1. Recherches « sans clic » – Google propose de plus en plus de réponses directement dans la page de résultats (featured snippets, knowledge panels, réponses générées par IA), éliminant le besoin de cliquer sur un site.

  2. Visibilité hors-site – réseaux sociaux, forums, outils d’IA (ChatGPT, Bing Chat…) et plateformes communautaires (LinkedIn, Reddit, YouTube…) sont désormais des lieux clés de découverte, mais renvoient peu de trafic dans les analytics classiques.

Par exemple, un internaute cherchant « meilleur CRM » peut lire un résumé IA de Google mentionnant HubSpot sans cliquer sur le lien du site. HubSpot gagne alors en notoriété sans augmenter ses sessions web directes. De même, SparkToro montre qu’un post LinkedIn sans lien externe obtient 10× plus de portée qu’un post avec lien, ce qui génère beaucoup d’engagement hors site – et donc autant de pistes influentes sans apparaître comme trafic référent.

quel est le meilleur outil crm - google

En somme, votre influence – mentions, avis, recommandations, contenus sur d’autres plateformes et références IA – devient souvent plus déterminante que vos pages vues.

Aller au-delà du trafic : sur quoi se concentrer à la place

Pour générer une croissance durable, privilégiez ces axes plutôt que la simple acquisition de visites :

  • Comprendre le comportement de votre audience
    Menez enquêtes, analyses démographiques et veille des communautés en ligne. Identifiez où se trouvent vos clients idéaux, ce qui les motive et comment ils consomment l’information. Comme l’affirme Rand Fishkin,

« comprendre le comportement de son audience est plus crucial que jamais ». Cette connaissance vous permet de cibler des canaux et des messages réellement efficaces.

  • Optimiser l’adéquation offre–audience (CRO/P-M fit)
    Plutôt que de toucher une audience plus large, faites en sorte que votre offre soit irrésistible pour ceux qui vous trouvent déjà : affinez vos messages, testez vos pages (A/B testing), supprimez les frictions du parcours client. Passer d’un taux de conversion de 1 % à 2 % double vos ventes pour le même trafic.

  • Exploiter le marketing local
    Pour les acteurs régionaux, le local génère un fort taux de conversion : 76 % des internautes effectuant une recherche « près de moi » sur mobile visitent un commerce dans la journée, et 28 % d’entre eux réalisent un achat. Travaillez votre référencement local, optimisez votre fiche Google Business et encouragez les avis.

  • Adopter le marketing événementiel et l’engagement direct
    Webinaires, ateliers, salons ou rencontres en ligne créent un lien humain et captent une audience hautement qualifiée. Selon une enquête Splash, 47 % des marketeurs jugent que les événements en présentiel offrent le ROI le plus élevé de tous les canaux, et la plupart les considèrent comme essentiels à la croissance.

  • Construire votre marque avec du contenu et du storytelling
    Le storytelling émotionnel peut augmenter les conversions de 96 % et créer une valeur client à long terme 3× supérieure pour les clients liés émotionnellement à la marque. Investissez dans des récits clients, des vidéos, des podcasts ou des séries d’articles qui suscitent l’adhésion et encouragent le bouche-à-oreille.


Il est temps de rompre avec l’obsession du trafic. En 2025, la croissance durable repose sur l’engagement ciblé plutôt que sur l’injection massive de visiteurs. Les taux de conversion moyens très bas et la montée des coûts publicitaires rendent la course au trafic coûteuse et inefficace. Parallèlement, de grandes entreprises prouvent qu’on peut perdre des visiteurs tout en gagnant des ventes, en misant sur l’influence, la réputation et l’expérience client.

Pour votre entreprise, concentrez-vous sur :

  1. La compréhension fine de votre audience.

  2. L’optimisation de votre offre pour ceux qui vous trouvent déjà.

  3. Des canaux à fort impact (local, événements, storytelling).

Ainsi, vous maximiserez votre retour sur investissement et verrez vos ventes progresser – même si votre trafic n’augmente pas.


Sources :

  • Fishkin, R. « Traffic Is Down; Revenue Is… Up? » SparkToro Blog. 27 janvier 2025.

  • Hufford, B. Publication LinkedIn sur le trafic vanity vs clients réels.

  • Reynolds, W. « Why 2020’s SEO KPIs Won’t Work in 2024… » Seer Interactive. 23 septembre 2024.

  • Taux de conversion : WordStream, Conversion Rate Benchmarks; Capturly/IRP Commerce (via Growcode).

  • Coûts publicitaires : LocaliQ (via Search Engine Journal) 2024 Google Ads Benchmarks; BubbleUp Marketing, 24 octobre 2024.

  • Trafic vs chiffre d’affaires HubSpot : analyse SparkToro; Invezz finance news.

  • Recherches sans clic & IA : exemple SparkToro/Google.

  • Statistiques recherche locale : Think with Google, rapport 2019 sur la recherche locale.

  • ROI événementiel : enquête Splash via ExplodingTopics, 2023.

  • Storytelling émotionnel : CXL 2023 via HuddleCreative.

Pour augmenter vos revenus en ligne, concentrez vous sur l’expérience utilisateur

Il y a deux ans, j’ai eu le privilège de donner une conférence à la prestigieuse Université McGill de Montréal, au Québec. Chaque année, je suis invité à partager mon point de vue sur l’évolution du marketing. Ma philosophie a toujours été que l’avenir du marketing est intrinsèquement lié au développement des algorithmes. De plus, je suis tombé sur ce podcast de Freakonomics soulignant certains problèmes rencontrés par la recherche Google.

Aujourd’hui, presque tout le monde compte sur Internet et les appareils mobiles pour découvrir de nouvelles informations, choisir des destinations de voyage, sélectionner des livres à lire, trouver des événements auxquels assister, explorer de la musique ou décider quels films regarder.

Le point est clair : pour réussir, les spécialistes du marketing doivent exploiter efficacement les plateformes qui les connectent à leurs marchés, des plateformes comme Google, Amazon, Meta et Netflix. Une récente étude de Sparktoro a analysé où les utilisateurs passent du temps par rapport à l’origine du trafic de référence. Les résultats soulignent que Google reste la principale source de trafic de référence vers le web ouvert :

Oui, Google envoie près des 2/3 de tout le trafic de référence vers les sites Web américains (parmi les 170 principaux référents). Cependant, cela ne signifie pas que Google est le meilleur, le seul ou le plus important endroit pour chaque propriétaire/spécialiste du marketing de site Web doit concentrer ses efforts de croissance.

C’est pourquoi je consacre beaucoup de temps à l’analyse de Google, ou d’Alphabet, si vous préférez. Bien que l’entreprise soit engagée dans une bataille féroce dans le domaine de l’IA, la recherche reste sa pierre angulaire. Il suffit de regarder ses revenus et ses coûts d’acquisition de trafic (TAC).

Pourquoi les spécialistes du marketing devraient se soucier de Google

Le 18 octobre 2023, Pandu Nayak, alors vice-président de la recherche chez Google, a témoigné lors des audiences antitrust.

Ses idées ont été incroyablement éclairantes pour les professionnels du marketing de recherche désireux de comprendre le fonctionnement interne de Google. Vous pouvez lire la transcription ici.

Navboost et Glue

Nayak a expliqué en détail les facteurs de classement comme Navboost et son homologue Glue, qui utilisent les données de clics des 13 derniers mois pour influencer les classements de recherche et les fonctionnalités SERP.

  • Navboost : cet outil analyse les données de clics pour aider à classer les sites Web. Il suit la fréquence à laquelle les utilisateurs cliquent sur des liens spécifiques pour des requêtes particulières. Plus un site reçoit de clics, plus Navboost est susceptible de le considérer comme un résultat pertinent, ce qui pourrait améliorer son classement.
  • Glue : alors que Navboost se concentre sur le classement des pages individuelles, Glue prend en compte les interactions des utilisateurs avec les fonctionnalités de la page de résultats de recherche (SERP), telles que les carrousels de vidéos, les packs d’images et les extraits en vedette. Glue utilise les mêmes données utilisateur sur 13 mois pour prioriser les éléments SERP qui améliorent la satisfaction des utilisateurs. Par exemple, si les utilisateurs interagissent fortement avec les carrousels de vidéos pour les recherches de films, Glue priorisera ces fonctionnalités pour des requêtes similaires.

Modèles d’apprentissage profond et évaluation humaine

Google exploite également des modèles d’apprentissage profond avancés tels que RankBrain, RankEmbed, BERT et DeepRank. Ces modèles analysent le comportement des utilisateurs, y compris les clics et les requêtes de recherche, pour affiner continuellement les résultats de recherche. De plus, Google emploie des évaluateurs humains pour attribuer des scores de “Satisfaction de l’information” (IS). Ces évaluations aident Google à s’assurer que ses algorithmes fournissent des résultats de haute qualité.

Principaux points à retenir pour les entrepreneurs du commerce électronique

Comprendre les algorithmes de Google peut éclairer votre stratégie d’acquisition, car l’engagement des utilisateurs est désormais un facteur de classement essentiel. Voici les éléments essentiels sur lesquels les spécialistes du marketing devraient se concentrer :

Prioriser l’engagement des utilisateurs

Au lieu de se focaliser sur le nombre total de sessions ou le volume de trafic, déplacez votre attention vers les métriques d’engagement dans des outils comme Google Analytics. Les indicateurs clés incluent : Profondeur de défilement Connexions Ajouts au panier Paniers abandonnés Pourcentage de visiteurs réguliers Utilisation de la recherche sur site Obtenir des “clics longs” – où les utilisateurs restent sur votre site – est plus précieux que des taux de rebond élevés. Évitez de donner aux utilisateurs une raison de retourner aux résultats de recherche en offrant une expérience utilisateur de premier ordre.

Tecovas : Le meilleur de sa catégorie

J’aime particulièrement ce que fait Tecovas. Leur site Web est un paradis pour tous les fans de vêtements western ou de bottes de cowboy. Voici quelques points forts de leur UX :

  • Image de marque claire et cohérente : Le logo Tecovas est placé bien en évidence, assurant la reconnaissance et la confiance de la marque. L’utilisation cohérente des polices, des couleurs et des éléments de conception améliore le rappel de la marque.
  • Hiérarchie visuelle forte : Les images de produits sont grandes, claires et bien éclairées, aidant les clients à comprendre instantanément ce qui est offert. Les principales caractéristiques du produit (par exemple, imperméable, embout composite, assise plantaire amovible) sont affichées dans un format infographique, ce qui rend l’information digestible et attrayante.
  • Conception axée sur le mobile : La mise en page est optimisée pour les appareils mobiles, avec une interface propre, une navigation facile et un minimum de défilement nécessaire pour accéder aux informations clés. De grands éléments cliquables assurent une expérience utilisateur mobile fluide.
  • Récit axé sur les fonctionnalités : La section “Fabriqué avec la technologie Tecovas” met en évidence la différenciation des produits avec des avantages clairs. Cette approche souligne pourquoi le produit se démarque. Les explications visuelles (comme le schéma de botte en coupe) rendent les caractéristiques techniques accessibles à tous les publics.
  • Appel à l’action (CTA) : Un lien “Acheter maintenant” bien visible en haut encourage une action immédiate. Le placement stratégique des catégories de produits garantit que les utilisateurs peuvent rapidement parcourir d’autres articles de la collection.
  • Contenu éducatif : La section de style infographique éduque les utilisateurs sur les avantages du produit (par exemple, système imperméable, normes ASTM). Le contenu éducatif renforce la confiance et réduit l’hésitation de l’acheteur.
  • Conception centrée sur le client : Le site Web se concentre sur l’utilisateur en fournissant des détails sur le produit et les avantages de la technologie dès le départ, réduisant ainsi le besoin de clics supplémentaires. La priorité accordée à la transparence avec des descriptions détaillées des produits renforce la confiance et l’engagement des utilisateurs.
  • Navigation fluide : Le menu et les options de recherche sont intuitifs, garantissant que les utilisateurs peuvent facilement trouver ce dont ils ont besoin sans frustration. La catégorisation des produits (par exemple, “Gamme de travail”) simplifie l’expérience de navigation.

Trois principes fondamentaux pour le succès

L’expérience utilisateur est primordiale :

Créez un site Web à chargement rapide, adapté aux mobiles et facile à naviguer. Une expérience fluide encourage les utilisateurs à rester, signalant à Google que votre site est précieux.

Construisez une marque forte :

Investissez dans des campagnes de notoriété de marque multiplateformes. Une marque reconnaissable se traduit souvent par des taux de clics plus élevés, ce qui peut améliorer votre classement dans les moteurs de recherche.

Créez un contenu de haute qualité axé sur l’intention de recherche :

Comprenez l’intention derrière les recherches des utilisateurs et répondez à ces besoins avec un contenu complet et attrayant. Utilisez divers formats tels que des blogs, des vidéos et des infographies pour capter l’attention. C’est exactement ce que font des marques comme Tecovas. Elles ont une très forte stratégie de contenu de marque et une présence sur les réseaux sociaux. Sur Instagram, elles publient du contenu attrayant et elles sont cohérentes.

Restez informé des mises à jour de l’algorithme

Bien que la manipulation de facteurs de classement spécifiques puisse ne pas donner de résultats à long terme, rester informé des changements d’algorithme de Google vous assure d’adapter constamment votre stratégie pour rester compétitif. L’avenir du marketing réside dans la compréhension et l’exploitation des algorithmes qui régissent les interactions des utilisateurs. En se concentrant sur l’engagement des utilisateurs, en améliorant l’expérience du site Web et en se tenant informé des changements algorithmiques, les spécialistes du marketing peuvent se positionner pour un succès à long terme dans un paysage numérique de plus en plus concurrentiel.

Continuons à explorer et à partager des idées pour rester en tête dans le monde en constante évolution du marketing numérique.

Restez en contact avec moi.

Why SEO Rankings Are Overrated: The Real Key to Google Success Lies in User Behavior

Two years ago, I had the privilege of giving a conference at the prestigious McGill University in Montreal, Québec. Each year, I am invited to share my perspective on the evolution of marketing. My philosophy has always been that the future of marketing is intrinsically tied to the development of algorithms. Moreover I came across this podcast from Freakonomics highlighting some issues encounters by Google search. 

Today, virtually everyone relies on the internet and mobile devices to discover new information, choose travel destinations, pick books to read, find events to attend, explore music, or decide what movies to watch.

The point is clear: to succeed, marketers must effectively leverage the platforms that connect them to their markets—platforms like Google, Amazon, Meta, and Netflix. A recent study by Sparktoro analyzed where users spend time versus where referral traffic originates. The findings underscore that Google remains the leading source of referral traffic to the open web:

“Yes, Google sends close to 2/3rds of all referral traffic to US websites (of the top 170 referrers). No, that doesn’t mean Google is the best, only, or most important place for every website owner/marketer to put their growth efforts.”

the web largest traffic referrers by Sparktoro

This is why I devote significant time to analyzing Google—or Alphabet, if you will. While the company is engaged in a fierce battle in the AI space, search remains its cornerstone. Just look at its revenues and Traffic Acquisition Costs (TAC).

Why Marketers Should Care About Google

On October 18, 2023, Pandu Nayak, then Vice President of Search at Google, provided testimony during the anti-trust hearings. 

Pandu Nayak Vice President of Search

His insights were incredibly enlightening for search marketing professionals eager to understand Google’s inner workings. You can read the transcript here.

Navboost and Glue

Nayak elaborated on ranking factors like Navboost and its counterpart Glue, which use click data from the past 13 months to influence search rankings and SERP features.

  • Navboost: This tool analyzes click data to help rank websites. It tracks how often users click on specific links for particular queries. The more clicks a site receives, the more likely Navboost is to view it as a relevant result, potentially boosting its ranking.

  • Glue: While Navboost focuses on ranking individual pages, Glue considers user interactions with features on the search results page (SERP) such as video carousels, image packs, and featured snippets. Glue uses the same 13-month user data to prioritize SERP elements that enhance user satisfaction. For example, if users engage heavily with video carousels for movie searches, Glue will prioritize those features for similar queries.

Deep Learning Models and Human Evaluation

Google also leverages advanced deep learning models such as RankBrain, RankEmbed, BERT, and DeepRank. These models analyze user behavior, including clicks and search queries, to continuously refine search results.

Additionally, Google employs human evaluators to assign “Information Satisfaction” (IS) scores. These evaluations help Google ensure its algorithms deliver high-quality results.

Key Takeaways for E-Commerce Entrepreneurs

Understanding Google’s algorithms can inform your acquisition strategy because user engagement is now a critical ranking factor. Here are the essential elements marketers should focus on:

Prioritize User Engagement

Instead of obsessing over total sessions or traffic volume, shift your focus to engagement metrics in tools like Google Analytics. Key indicators include:

  • Scroll depth
  • Logins
  • Add-to-cart actions
  • Abandoned carts
  • Percentage of repeat visitors
  • On-site search usage

Achieving “long clicks”—where users stay on your site—is more valuable than high bounce rates. Avoid giving users a reason to return to search results by delivering a top-tier user experience.


Tecovas : Best in class

I particularly like what Tecovas is doing. Their website is a heaven for all the fans of western wear or cowboy boots. Here are few highlights from their UX : 

Clear and Consistent Branding:

    • The Tecovas logo is prominently placed, ensuring brand recognition and trust.
    • Consistent use of fonts, colors, and design elements enhances brand recall.

Strong Visual Hierarchy:

      • Product images are large, clear, and well-lit, helping customers instantly understand what’s being offered.

Key product features (e.g., waterproof, composite toe, removable footbed) are displayed in an infographic-style format, making information digestible and engaging.

Mobile-First Design:

        • The layout is optimized for mobile devices, with a clean interface, easy navigation, and minimal scrolling needed to access key information.
        • Large, clickable elements ensure a smooth mobile user experience.

Feature-Driven Storytelling:

    • The section “Made with Tecovas Technology” highlights product differentiation with clear benefits. This approach emphasizes why the product stands out.
    • Visual explanations (like the cutaway boot diagram) make technical features accessible to all audiences.

Call-to-Action (CTA):

    • A prominent “Shop Now” link at the top encourages immediate action.
    • Strategic placement of product categories ensures users can quickly browse other items in the collection.

Educational Content:

    • The infographic-style section educates users about the product’s benefits (e.g., waterproof system, ASTM standards). Educational content builds trust and reduces buyer hesitation.

Customer-Centric Design:

      • The website focuses on the user by providing product details and technology benefits upfront, reducing the need for additional clicks.
      • Prioritizing transparency with detailed product descriptions enhances user trust and engagement.

Seamless Navigation:

        • The menu and search options are intuitive, ensuring users can easily find what they need without frustration.
        • Categorization of products (e.g., “Work Line”) simplifies the browsing experience.


Three Core Principles for Success

  1. User Experience is Paramount:

    Create a fast-loading, mobile-friendly, and easy-to-navigate website. A seamless experience encourages users to stay, signaling to Google that your site is valuable.

  2. Build a Strong Brand:

    Invest in multi-platform brand awareness campaigns. A recognizable brand often results in higher click-through rates, which can enhance your search rankings.

  3. Create High-Quality, Intent-Driven Content:

    Understand the intent behind user searches and address those needs with comprehensive, engaging content. Use diverse formats such as blogs, videos, and infographics to capture attention. This is exactly what brands such as Tecovas are doing. They have a very strong brand content strategy and social media presence. On Instagram they publih engaging content and they are consistent. Tecovas on instagram

  4. Stay Informed About Algorithm Updates

While manipulating specific ranking factors may not yield long-term results, staying informed about Google’s algorithm changes ensures you’re always adapting your strategy to remain competitive.

The future of marketing lies in understanding and leveraging the algorithms that govern user interactions. By focusing on user engagement, enhancing website experience, and staying informed about algorithmic changes, marketers can position themselves for long-term success in an increasingly competitive digital landscape.

Let’s keep exploring and sharing insights to stay ahead in the ever-evolving world of digital marketing. 

Stay in touch with me.


FAQ: Insights from Pandu Nayak’s Testimony on Google Search

1. What is Navboost, and why is it important for SEO?

Navboost is a crucial Google ranking signal trained on user click data from the past 13 months. It helps Google understand which results users find most relevant for specific queries based on historical click patterns. Understanding Navboost is vital for SEOs because it highlights the importance of user engagement and satisfaction as ranking factors. Ultimately, it reinforces the need to create content that users find valuable and are likely to click on and spend time with.

2. How do Glue and Tangram relate to search results pages (SERPs)?

Glue is the system that informs which additional features (like video carousels or “People Also Ask” boxes) are populated on a SERP. It likely logs user interactions with these features over the last 13 months. Tangram is the system that assembles all the features on a SERP, acting as the “puzzle solver” that arranges the elements on the page.

3. What role do deep learning models like RankBrain, RankEmbed BERT, and DeepRank play in Google’s ranking process?

RankBrain, RankEmbed BERT, and DeepRank are deep learning models used by Google to understand language and content better. While these models are trained in part on click data, RankBrain analyzes a subset of candidate documents. RankEmbed BERT turns words into math using word embeddings and vectors. DeepRank refines search results based on a deeper understanding of user intent and content relevance. These models help Google to interpret the nuances of language and context, but Google is hesitant to rely on them exclusively.

4. What are Information Satisfaction (IS) scores, and how does Google use them?

Information Satisfaction (IS) scores are ratings on a 100-point scale assigned by human Search Quality Raters based on Google’s Search Quality Evaluator Guidelines. Google uses these scores to measure search performance, fine-tune algorithms, and conduct experiments. IS scores provide a gut check on the impact of algorithmic changes and help Google quickly assess whether a new feature or update is improving user satisfaction.

5. What is interleaving, and how does Google use it in algorithm testing?

Interleaving is an algorithm testing method where users are presented with a blended set of results from different algorithm versions, and their interactions (clicks, dwell time, etc.) are analyzed to determine which version performs better. Instead of traditional A/B testing, interleaving allows Google to compare algorithm performance in a more nuanced way, taking into account the relative performance of different result sets.

6. How important are engagement signals (user interaction signals) for SEO?

Engagement signals, such as long clicks and reduced pogo-sticking (returning quickly to the search results page), are essential for SEO. They indicate user satisfaction, which Google uses to assess the relevance and value of a webpage. SEOs should focus on creating content that thoroughly satisfies user intent and provides a positive user experience to improve engagement signals.

7. How can SEOs apply the knowledge of Google’s algorithms (like Navboost) to their client work?

Understanding Google’s algorithms enables SEOs to focus on long-term strategies such as creating valuable, user-centric content that satisfies user intent and provides a positive user experience. Knowing that Navboost relies on click data, SEOs can focus on brand building, creating compelling meta descriptions, and scaling short-form content to capture long-tail queries. It also involves understanding user intent and catering to the “why” behind their searches to provide comprehensive solutions.

8. How does the author interpret Google’s past statements about not using user signals in ranking?

The author believes that Google’s past statements were often technically correct, but didn’t present the whole truth. While Google might have denied using specific metrics like click-through rate as a direct ranking factor, they did consider user interactions within a larger model. This approach allowed Google to be accurate while maintaining secrecy about the specific details of their ranking algorithms.

Comment utiliser l’IA dans sa stratégie SEO

Le référencement SEO et l’intelligence artificielle (IA) jouent un rôle crucial dans le paysage numérique actuel, en particulier pour les entrepreneurs désireux d’optimiser leur présence en ligne et de rationaliser leurs activités sans coûts élevés. La compréhension et la mise en œuvre de techniques SEO et d’IA de base peuvent améliorer considérablement la visibilité et l’efficacité.

La principale contrainte pour les entrepreneurs est de bien définir les objectifs et les cibles à atteindre. Il arrive très souvent que les entrepreneurs definissent des objectifs un peu trop ambitieux. Ceci a malheureusement pour conséquence la fin des projets ou des investissements trop onéreux en Paid média.

L’usage efficace du SEO et de l’IA nécessitent tous les deux de la patience et une planification stratégique. Les résultats immédiats sont rares, et en être conscient permet de fixer des objectifs et des jalons réalistes.

Quelques étapes pour se lancer

1. Ressources d’apprentissage gratuites :

Consultez la série de vidéos Google sur le fonctionnement de la recherche

SEO

  • Une ressource gratuite qui couvre les bases du référencement SEO.
  • Lire le Blogs Moz et Search Engine Land : Ces blogs proposent des informations et des tendances avancées.

IA

  • Elements of AI : Un cours en ligne gratuit pour comprendre les bases de l’intelligence artificielle.
  • AI4ALL Open Learning : Fournit des ressources pour comprendre comment l’IA est utilisée dans des scénarios concrets.

2. Utiliser des outils gratuits :

Outils SEO

  • Google Analytics : Suit le trafic du site Web et le comportement des utilisateurs.
  • Search Console de Google : Aide à surveiller les performances du site dans les résultats de recherche Google.
  • Keyword Planner : Utile pour trouver des mots-clés à cibler.

Outils IA

  • Google AI : Explorez divers outils d’IA gratuits proposés par Google.
  • IBM Watson : Accédez à des API gratuites pour intégrer des fonctionnalités d’IA à vos processus métier.

Implémentation du SEO et de l’IA sur votre site Web

1. Optimisation de votre site Web pour le référencement SEO

  • SEO On-Page : Concentrez-vous sur les balises META, le contenu de qualité et une structure de site optimisée pour le référencement SEO. Il existe de nombreux sites internet et des experts qui vous donnent les meilleurs prompts pour le SEO. Screaming frog dans sa version 20 a une intégration directe avec ChatGPT.
  • SEO Off-Page : Mettez l’accent sur la création de backlinks et l’amélioration de votre présence en ligne.

2. Intégration de l’IA pour une expérience utilisateur améliorée

  • Chatbots : Utilisez des services gratuits de chatbot à base d’IA pour améliorer le service client.
  • Moteurs de personnalisation : Implémentez l’IA pour personnaliser les expériences utilisateur en fonction de leur comportement.

Techniques et intégrations avancées

1. Création de contenu avec SEO et IA

  • Utilisez des outils d’IA pour générer des idées de contenu ou rédiger des brouillons d’articles. Pas besoin d’aller trop loin. La version gratuite de Gemini (voir exemples plus bas) vous permet de générer des centaines d’idées de contenu pour votre business.  Astuce : posez lui une question récurrente de vos clients ou prospects. Il fera le reste.
  • Optimisez le contenu pour le référencement SEO afin d’améliorer la visibilité et la portée.

2. Analyses et SEO basés sur l’IA

  • Implémentez des outils d’IA pour analyser les données du site Web et optimiser les stratégies de référencement SEO en fonction des informations obtenues.
  • Utilisez l’IA pour prédire les tendances et ajuster les tactiques de référencement SEO en conséquence.

Conclusion :

En tant qu’entrepreneur, maîtriser le référencement SEO et l’IA signifie adopter de nouvelles technologies et techniques en mettant l’accent sur la croissance et l’apprentissage à long terme. Ces deux domaines évoluent continuellement, et rester informé est la clé du succès.

Google wants more content from experts : 10 content ideas to win it all

Google is suggesting to write content for Humans and not for  bots. In an article published recently on their official blog:  more content by people for people  in search Google, Danny Sullivan, their public liaison for search stated this

Next week, we’ll launch the “helpful content update” to tackle content that seems to have been primarily created for ranking well in search engines rather than to help or inform people. This ranking update will help make sure that unoriginal, low quality content doesn’t rank highly in Search, and our testing has found it will especially improve results related to online education, as well as arts and entertainment, shopping and tech-related content.

Relevant content will win

Content written by experts always win. We can just give a look to NYT or Wired or ESPN websites to assess the success of their content. In general it is unique (because of the details, facts and information inside), authoritative because of the strong criteria and editorial guidelines; and sometimes collaborative (they have interview of experts)

Read more on what is an expert on HBR.

Relevancy here means content that answers searchers interests and needs in the best way possible.  It has to be mention that content comes in various format (text, images, video, maps, audio, etc). We donèt know at this stage if Google is going to increase the weight of experts content on all these formats but minimaly we can assume that they will look at the people behind each publication.

Since 2018 google associated high quality to the expertise. It is then logic for them to solve the relevancy by increasing the weight of EAT


Google's E-A-T and Y.M.Y.L


We work hard to make sure the pages we show on Search are as helpful and relevant as possible. To do this, we constantly refine our systems: Last year, we launched thousands of updates to Search based on hundreds of thousands of quality tests, including evaluations where we gather feedback from human reviewers.

It is clear that Google valued unique and relevant content. To achievd their goals their tur to surveys, analysis and feedback gathering.

What does this means for writers : Collaborate with experts.

Many content experts and writers were frustrated in the past because their content were not winning in search. Actually, SEO is clearly different from pure content production because Google uses different criteria to rank results pages. Content or the keywords within the content are part fo those criteria among backlinks, site speed, etc. But few years ago, Google launched new algorithm claiming to have a better understanding of the searcher’s query. Writers and experts are clearly benefitting from BERT if they are able to

    1. Collaborate with experts
    2. Adopt a testing philosophy to validate if the content produced fits users needs. No shortcut.

8 types of content you can create to benefit from this Google’s update

 There are plenty of opportunities to capture if you write relevant and diverse content. 

To help start rethinking your content strategy, here are few content ideas that will get you started

Remember 90% of people stays on the first page of Google. But the results pages on google is so diverse. and it now features more than 10 blue links.


  • Industry trend
    • The future of AI in healthcare
  • Opinion
    • X Reasons why you should start saving to fight inflation
  • Personal Stories
    • How I beat cancer…
  • Case study
    • Just give a look at Mckinsey or Accenture case studies
  • Guide
    • How to become goods in Maths
  • Tools
    • X must have tools to succeed in SEO
  • Knowledge sharing
    • What is global warming?
  • Experts review
    • Drones Experts review